Empowering K-12 Students' Digital Competence
through Collaborative VR Creation Activities
Submitted by
Huo, Xiao Yi
A Thesis
submitted in fulfilment of the
requirements for the Degree of
Doctor of Education
at
The University of Hong Kong
Supervisors Dr. Jeremy T. D. Ng / Dr. Xiao Hu
June 2026
Ethics Approval: This study was approved by the Human Research Ethics Committee (HREC), University of Hong Kong (Reference No. EAE25015)
Table of Contents
Chapter 1: Research Background 9
1.1.1 The Global Imperative: Digital Competence in an Era of Technological Disruption 9
1.1.2 The Competence Gap: Why Traditional Pedagogy Falls Short 10
1.1.3 The Promise and Paradox of Immersive Technology in Education 12
1.1.4 Reducing Technical Barriers in Collaborative VR Creation with Teacher-Mediated Assets 13
1.1.5 Research Problem and Purpose 14
1.1.6 Systematic Research Gaps: A Gap Matrix 15
1.2 Theoretical Foundations 18
1.2.1 Constructionism: The Pedagogical Foundation 19
1.2.2 The DigComp 2.1 Framework: The Assessment Structure 20
1.2.3 Collaborative VR Creation: Bridging Theory and Assessment 21
1.2.4 Activation Mapping: How Phases Cross Dimensions 22
Chapter 2: Literature Review 28
2.1 Theoretical Foundations 28
2.1.1 The Constructivist-Constructionist Position 29
2.1.2 The Direct-Instruction Critique 30
2.1.3 From Debate to Design: Scaffolded Creation 31
2.2 Digital Competence in STEM Education 32
2.2.1 The DigComp Framework: Evolution and Operationalisation 32
2.2.2 Developmental Pathways in K-12 STEM Contexts 39
2.2.3 Current State, Assessment, and Systemic Challenges 40
2.3.2 Collaboration in Maker Learning 42
2.3.3 Scaffolding under Technical Complexity 43
2.4 VR Creation Activities in Education 44
2.4.2 Educational Benefits of Student VR Creation Activities 46
2.4.3 Collaborative VR Creation Activities: Dynamics and Tools 47
2.4.4 Impact of VR Creation Activities on Digital Competence 49
2.5 Technical Scaffolding and the Expertise Reversal Effect 56
2.5.1 Cognitive Load Theory and Scaffolding 56
2.5.2 The Expertise Reversal Effect and Boundary Condition Testing 58
2.5.3 Scaffold Dependency and the Rationale for Progressive Task Complexity 60
2.6 Analysing Collaborative Learning in Digital Environments 61
2.6.1 The Evolution of CSCL Analytics 61
2.6.2 Learning Analytics and System Logs in Immersive Environments 62
2.6.3 Multimodal Analytics in Virtual Reality Learning Environments 62
2.6.4 Challenges and Future Directions in VR Learning Analytics 63
2.7 Research Gaps and Chapter Summary 64
Chapter 3: Research Design and Methods 67
3.1 Research Paradigm: Design-Based Research 67
3.1.1 Theoretical Origins of DBR 67
3.1.2 Methodological Positioning 69
3.1.3 Rationale for DBR Selection in This Study 69
3.1.4 DBR Implementation Framework 71
3.2 Research Design Overview 73
3.2.1 Mixed-Method Design Logic 73
3.2.2 Three-Cyclical Structure of the Intervention 75
3.2.3 Cross-Cycle Comparison Logic 76
3.2.4 Research Design Considerations 77
3.3 Participants and Research Context 78
3.3.1 Participant Selection Logic 78
3.3.5 Institutional Context 82
3.4.1 Digital Competence Assessment 84
3.4.2 Platform Interaction Logging 90
3.4.3 Focus Group Interviews 96
3.4.4 Alignment of Methods with Research Questions 97
3.5 Data Analysis Procedures 99
3.5.1 Quantitative Analysis 99
3.5.2 Process Analytics Framework 102
3.5.3 Qualitative Analysis 106
3.5.4 Integration Strategy 107
3.6 Ethical Considerations 108
3.7 Quality Control Measures 111
3.8 Limitations and Mitigations 111
Chapter 4: Cycle 1 Findings: The Baseline and Technical Barriers 116
4.1 Overview of Cycle 1 Intervention 116
4.2 Participants and Research Context 117
4.3 Intervention Design and Implementation 118
4.4 Quantitative Findings: Digital Competence Development 119
4.4.1 Information and Data Literacy 120
4.4.2 Communication and Collaboration 121
4.4.3 Digital Content Creation 121
4.4.5 The Problem Solving Dimension 122
4.5 In-Depth Analysis of Failure Cases 123
4.5.1 Ecological Constraints: The Device Management Challenge 123
4.5.2 Technical Barriers: The Interface Complexity Challenge 124
4.5.3 Case Study: Group 3's Collapse 125
4.5.4 Case Study: Group 7's Partial Success 126
4.5.5 Cross-Case Analysis: Patterns of Failure 127
4.6 Discussion and Implications for Cycle 2 128
4.6.1 Technical Barriers as the Dominant Barrier 128
4.6.2 Design Principles for Cycle 2 129
Chapter 5: Cycle 2 Findings: Teacher-Mediated Asset Support and the Redesigned Intervention 131
5.1 Cycle 2 Intervention Design 131
5.1.1 From Manual Capture to AI-Generated Worlds: The Core Redesign 131
5.1.2 Maintaining a Controlled and Collaborative Environment 134
5.2 Quantitative Findings: Impact on Digital Competence (RQ1) 137
5.2.1 Significant Gains in Two Dimensions, Decline in One 138
5.2.2 Cross-Cycle Comparison: Cycle 1 vs. Cycle 2 139
5.3 Log Data Analysis: Unpacking the Collaborative Process 141
5.3.1 Defining the Process Analytics Framework 141
5.3.2 Analytical Window and Operationalization of Log Events 142
5.3.3 Case Selection and Rationale (Typical Cases) 145
5.3.4 Analytical Approach: Log Data and Process Metrics 146
5.3.5 Comparative Process Analysis: Integrating Timelines, Heatmaps, and Gini 152
5.3.6 Summary of Process Patterns 156
5.4 Qualitative Insights: Unpacking the Mechanisms of Engagement and Difficulties 157
5.4.1 Catalysts for Sustained Collaboration: AIGC and Concurrent Assembly (RQ2) 157
5.4.2 Challenges and Barriers: Physical, Cognitive, and Collaborative Difficulties (RQ2) 159
5.4.3 Student-Proposed Scaffolding and Future Iterations 160
5.5 Discussion: Synthesising Competence, Flow, and Difficulties 161
5.5.1 Answering RQ1: The Quantitative Shift in Digital Competence 161
5.5.2 Answering RQ2: Collaboration Dynamics and Student Engagement 164
5.5.3 Answering RQ2: Identifying Challenges and Informing Scaffold Design 164
5.7 Triangulation Matrix: Quantitative-Qualitative-Log Convergence 166
5.8 Key Findings and Implications for Cycle 3 167
Chapter 6: Cycle 3 Findings: Testing with a High-Achieving Cohort 169
6.1 Cycle 3 Design, Participants, and Data Collection 169
6.1.1 Boundary Condition Testing: Why This Sample? 169
6.1.2 Baseline Difference and The Interpretation Caveat 171
6.1.3 Propensity score matching and Cross-cycles comparison 171
6.2 Problem Analysis and Design Refinement 172
6.2.1 Identifying the Collaboration Gap: The Need for Multimodal Integration 172
6.2.2 Refined Intervention Design: The multimodal task 173
6.3 Implementation of Cycle 3 174
6.3.1 Participants and Context 174
6.3.2 Procedure and Activities 174
6.3.3 Teacher-Mediated Asset Production Protocol 176
6.3.4 Data Collection Scope 177
6.4 Evaluation Phase I: Quantitative Results 178
6.4.1 High Baseline and No Significant Gains 178
6.4.2 Changes in Self-Assessment within Communication and Collaboration (CC) 182
6.4.3 Alternative Explanations for CC Score Drop 183
6.5 Evaluation Phase II: Qualitative Insights 184
6.5.1 Meeting Team Coordination Challenges: The Chaos of the Multimodal Integration 184
6.5.2 The Lost Tourist: From Navigation Failure to User Empathy 185
6.5.3 Breaking Through: External Validation and Collective Fulfilment 187
6.6 Summary of Cycle 3, and Contribution to Design Principles 189
6.6.2 Specific Contributions to Cross-Cycle Design Principles 190
Chapter 7: General Discussion and Design Principles 193
7.1 Cross-Cycle Synthesis and Theoretical Framing 193
7.1.1 Cross-Cycle Patterns: From Challenges to Design Principles 194
7.1.2 Cross-Cycle Empirical Trajectory 195
7.1.3 The CC Score Decline: A Plausible but Unverified Interpretation 196
7.2 Design Principle 1: Reduce Technical Barriers before Introducing Cognitive Challenge 198
7.2.2 Cross-Cycle Evidence 198
7.2.3 Implementation Conditions 199
7.2.6 Counter-Arguments and Alternative Explanations 200
7.3 Design Principle 2: Scaffold Collaboration, Not Just Coexistence 202
7.3.2 Cross-Cycle Evidence 202
7.3.3 Implementation Conditions 203
7.3.6 Counter-Arguments and Alternative Explanations 205
7.4 Design Principle 3: Calibrate AIGC Assistance to Preserve Problem-Solving Demand 206
7.4.2 Cross-Cycle Evidence 207
7.4.3 Implementation Conditions 208
7.4.6 Counter-Arguments and Alternative Explanations 209
7.5 Design Principle 4: Use Dominant Challenges as a Pedagogical Pivot, Not an Obstacle 211
7.5.2 Cross-Cycle Evidence 211
7.5.3 Implementation Conditions 212
7.5.6 Counter-Arguments and Alternative Explanations 213
7.6.2 Cross-Cycle Evidence 215
7.6.3 Guideline Status and Cycle 4 Requirements 216
7.6.4 Implementation Conditions (Hypothetical) 217
7.6.5 Proposed Operational Steps (Untested) 217
7.7 Limitations and Future Directions 218
7.7.1 Methodological Limitations 218
7.7.2 Practical Limitations 220
7.8.1 Alignment with China's 2022 Information Technology Curriculum Standards 223
7.8.2 Connection to International Frameworks: DigComp 3.0 224
7.8.3 Practical Implementation Roadmap for School Administrators 225
7.8.4 Teacher Professional Development Implications 227
7.8.5 Equity and Access Considerations 228
7.8.6 Recommendations for Curriculum Designers at District and National Levels 229
Appendix A: Glossary of Key Concepts 267
Teacher-Mediated AIGC Tools 271
Effective Output (EO) and Production-Output Ratio (POR) 272
Appendix B: Design Decision Log 274
Cycle 1: Baseline Design and the Emergence of Technical Barriers 274
Decision C1-D1: Baseline Pedagogical Design 274
Decision C1-D2: Group Size and Teacher-Assigned Composition 276
Decision C1-D3: The Collaborative Competence Paradox 277
Cycle 2: AIGC Introduction and the Emergence of Communication Challenges 278
Decision C2-D1: Replacement of Manual Capture with Teacher-Mediated Asset Production 278
Decision C2-D2: Concurrent Co-Editing Platform Architecture 280
Decision C2-D3: Open-Ended Asset Curation Versus Structured Prompt Scaffolding 281
Cycle 3: Multimodal Integration and the Emergence of Self-Assessment Changes 282
Decision C3-D1: Multimodal Asset Integration Task with Hub-and-Spoke Architecture 282
Decision C3-D2: Focused Sample Selection (Science and Technology Track) 284
Decision C3-D3: Hub-and-Spoke Methodological Adjustment 286
Appendix C: Codebook for Qualitative Analysis 288
Tier 1: Core Challenge Codes (Deductive-Phenomenon-Centred) 288
Tier 2: Emergent Inductive Codes 292
Coding Rules and Procedural Protocols 294
Appendix D: Statistical and Psychometric Output 297
D.1 Instrument Validation Summary 297
D.1.2 Item Descriptives and Corrected Item-Total Correlations (Cycle 2 Sample, N = 130) 298
D.1.3 Internal Consistency Reliability 299
D.2.1 Exploratory Factor Analysis 299
D.2.2 Confirmatory Factor Analysis 300
D.3 Cycle 1 Inferential Statistics (N = 41) 301
D.4 Cycle 2 Inferential Statistics (N = 127 matched pairs) 303
D.4.1 Dimension-Level Results 303
D.5 Cycle 3 Inferential Statistics (N = 47 matched pairs) 305
D.5.1 Dimension-Level Results 305
D.5.2 Item-Level Results (Selected) 305
D.6.1 Baseline Comparisons (Cycle 2 vs. Cycle 3, Independent-Samples t-tests) 306
D.6.2 Propensity Score Matching 307
Appendix E: Curriculum Materials 309
E.1 Cycle 1: Baseline Intervention Materials 309
E.1.1 Outdoor Panoramic Capture Task Sheet 309
E.1.2 720yun Platform Operation Guide 310
E.1.3 VR Story Assembly Checklist 311
E.2 Cycle 2: Teacher-Mediated AIGC Intervention Materials 311
E.2.1 Theme Selection Guide 311
Figure E-7 Voiceover Narrations-Gear City 314
E.2.4 VR Storybook Checklist and Progress Dashboard 315
Figure E-8 Checklist for the Teacher-Mediated AIGC Task Complexity 316
E.3 Cycle 3: Multimodal Intervention Materials 316
E.3.1 Digital Dunhuang Analysis Activity Guide 316
E.3.2 World Setting Excerpts 317
E.3.3 Hub-and-Spoke Story Map Template 318
E.3.4 Multimodal Asset Integration Guide 319
E.3.5 File Naming Convention and Collaboration Rules 319
E.3.6 Navigation Design Criteria 320
E.3.7 Peer Evaluation Form 320
E.4 Production Notes for Replicating This Intervention 321
E.4.1 AIGC Tool Specifications 321
E.4.3 Technical Requirements 322
Abstract
Collaborative virtual reality (VR) creation can help K-12 students develop digital competence, but little research guides its design for real classrooms, and the role of teacher-mediated tools based on AI-generated content (AIGC) is underexplored.
This study used design-based research (DBR) with three intervention cycles involving Grade 7 students (N = 41, 130, and 47) in one school in Dongguan, China. Grounded in constructionism and assessed against the DigComp 2.1 framework, it examined how collaborative VR creation influences students' digital competence and how design decisions shape that influence. The task design evolved across cycles: manual 360-degree panoramic capture (Cycle 1), teacher-mediated asset production using AIGC (Cycle 2), and multimodal integration with a high-achieving subsample (Cycle 3). Each redesign responded to the previous cycle's findings. Data included pre-post DigComp self-assessments, platform interaction logs in Cycle 2, and focus group interviews, analysed through paired-samples t-tests, process analytics, and thematic analysis.
The intervention improved digital competence selectively rather than uniformly. Cycle 1 produced significant gains on three of five dimensions, while technical barriers blocked higher-order learning. Cycle 2 removed these barriers and modestly improved the composite competence score (standardised mean change, Cohen's dz = 0.22; marginal under a straight-line sensitivity check), with exploratory dimension-level gains concentrated in Information and Data Literacy and Digital Content Creation. Problem Solving showed no growth, which students' own accounts attributed to AI handling the hard parts, and Digital Safety declined from the study's highest baseline, for which regression to the mean, reduced safety salience, and complacent attitudes remain competing explanations. Cycle 3 produced no significant gains on any dimension for high-achieving students, consistent with ceiling effects and expertise reversal. Collaboration self-assessment nevertheless declined even as observed negotiation grew richer, a pattern interpreted as recalibration among several possible explanations. Platform log analysis distinguished three collaboration patterns, and focus groups traced how reframed failures became design learning.
The study derives four design principles for scaffolded collaborative VR creation in school settings: reduce technical barriers before introducing cognitive challenge; scaffold genuine collaboration through structurally interdependent tasks; calibrate AIGC assistance to preserve problem-solving demand; and use dominant challenges as a pedagogical pivot, not an obstacle. A provisional guideline on maintaining digital safety awareness is proposed for future testing.
Limitations include the absence of a control condition, limited convergent validity of the self-report instrument, and the lack of platform log data in Cycle 3. In sum, when technical barriers are managed through calibrated scaffolding, collaborative VR creation is a practical way to build K-12 students' digital competence, and its effects depend on how scaffolding is tuned to the task and the learner.
Keywords:digital competence, collaborative virtual reality creation, teacher-mediated AIGC, design-based research, K-12 education, immersive learning
List of Tables
Table 1Research Gap Matrix: Current Literature and Study Contributions 17
Table 4Mapping of DigComp Dimensions to VR Creation Phases and Observable Indicators 36
Table 6DBR Implementation Phases and Study Application 72
Table 7Research Question Mapping to Data Strands and Instruments 74
Table 8Participant Demographics and Group Configuration Across Intervention Cycles 82
Table 9Digital Competence Assessment: Item Distribution and Sample Items 85
Table 10Content Validity Results by Domain 87
Table 1 1Convergent and Discriminant Validity Metrics by Domain 89
Table 1 2Action Types Recorded by CLEVR Platform 94
Table 1 3Alignment Between DigComp 2.1 Dimensions and CLEVR Data Sources 94
Table 1 4Alignment of Data Collection Methods with Research Questions 97
Table 1 5Process Analytics Metrics for Collaboration Quality 105
Table 17AIGC Asset Package Supporting Cycle 2 Themes 132
Table 18Cycle 1 vs. Cycle 2 Instructional Design Comparison 134
Table 19CLEVR Platform Dashboard: Teacher Assessment Dimensions 135
Table 2 0Descriptive Statistics and Paired-Samples t-test Results for Cycle 2 (N = 12 7) 137
Table 2 1Cross-Cycle Comparison of Pre-test Baselines and Effect Sizes 140
Table 2 2Event Classification Scheme for Platform Log Data 143
Table 2 3Overview of the Three Selected Typical Cases 146
Table 24Group Characteristics and Gini Coefficients (Effective Output) 148
Table 25Summary of Collaborative Process Indicators Across Three Typical Groups 156
Table 26Core Finding Triangulation Status 166
Table 27Multimodal VR Elements and Asset Sources in Cycle 3 174
Table 29Cross-Cycle Synthesis of the DBR Evolution 195
Table C.1Technical Barriers (TD) 289
Table C.2Team Coordination Challenges (TCC) 290
Table C.3Student Engagement (SE) 291
Table C.4AI-Related Ethical Awareness (AI-Ethics) 292
Table C.5Scaffold Request (Scaffold-Req) 292
Table C.6Empathy-Driven Design (Empathy-Design) 293
Table C.7Tool Adaptation Strategy (Tool-Adapt) 293
List of Figures
Figure 1 The Study's Two-Component Theoretical Foundation 17
Figure 3CLEVR Story Editor Interface. 89
Figure 4 Checklist and Progress Dashboard Interface. 90
Figure 5 Temporal Heatmap of Event Frequencies for Group S29 145
Figure 6 Temporal Heatmap of Event Frequencies for Group S04 146
Figure 7 Temporal Heatmap of Event Frequencies for Group S01 146
Figure 8Behavioural Timeline of Individual Member Contributions (High-Performing Group S29) 147
Figure 9Behavioural Timeline of Individual Member Contributions (Low-Performing Group S01) 147
Figure 10Behavioural Timeline of Individual Member Contributions (Mid-Performing Group S04) 148
Figure 11 Gini Coefficients for Effective Output Across Three Typical Groups 153
Figure 13 Radar chart showing the inward curve/drop in the CC dimension 179
Figure 14 Drafted Story Map showing the "1 centre, 5 radiating" spatial logic 189
Figure E-1A step-by-step capture instructionswith posture diagrams and camera setting 306
Figure E-2 The Importance of Navigation 307
Figure E-3 How Panoramic images work 309
Figure E-4Gear City: Story poster and narrative map 310
Figure E-5Illustrated Story Scenes-Gear City 310
Figure E-6 360°Spherical Panoramas-Gear City 310
Chapter 1: Research Background
1.1 Research Background
1.1.1 The Global Imperative: Digital Competence in an Era of Technological Disruption
Digital technology is now part of learning, work, and daily life. Klaus Schwab (2016) calls the Fourth Industrial Revolution (4IR) a coming together of artificial intelligence, computing, biotechnology, and immersive media. These developments are "blurring the lines between the physical, digital, and biological spheres" (Schwab, 2016, p. 1).
The first three industrial revolutions changed how goods were manufactured. The 4IR differs because it reaches into cognitive work. It automates judgement, processes large amounts of information, and manages social coordination. In doing so, it makes existing skills outdated and creates demand for new competencies that barely existed a decade ago (World Economic Forum, 2020).
The OECD has responded with its "Learning Compass 2030" framework, which redefines what schools should teach. The OECD (2019, p. 15) states that individuals need the capacity to "navigate towards the future we want, individually and collectively." This capacity requires three skill types: cognitive and metacognitive skills, social and emotional skills, and practical and creative skills. Within this context, digital competence has moved from a peripheral concern to a core educational goal. It is no longer a marginal technical skill but a prerequisite for citizenship.
To give this abstract concept a practical structure, the European Commission developed the Digital Competence Framework for Citizens (DigComp). This study uses DigComp 2.1 (Carretero et al., 2017), and its five competence dimensions provide the structure for assessing student outcomes (see Section 1.2.2). DigComp has been widely used across European Member States for curriculum design, teacher training, and lifelong learning (Vuorikari et al., 2022).
DigComp has continued to evolve since this study began. Released in 2025, DigComp 3.0 (Cosgrove & Cachia, 2025) includes AI-related competences across all five dimensions. Even so, the empirical analyses in Chapters 4 to 6 use DigComp 2.1 because the assessment instrument of this study was designed and validated with the 2.1 descriptors. This choice keeps the methodology consistent; it does not mean that DigComp 2.1 is theoretically superior.
Global policy trends point in the same direction. In August 2024, UNESCO published the AI Competency Framework for Students (Miao et al., 2024). This framework asks schools to help students become responsible users and active co-creators of technology, not passive consumers. In November 2024, China's Ministry of Education announced the goal of universal AI education in K-12 schools by 2030 (Ministry of Education of the People's Republic of China, 2024). Together, these policies show that K-12 digital competence education can no longer be delayed or treated as optional.
1.1.2 The Competence Gap: Why Traditional Pedagogy Falls Short
Despite this policy support, there is still a wide gap between ambitious frameworks and classroom reality. Studies consistently show that K-12 graduates have less digital competence than policy documents assume (Calvani et al., 2010; Ferrari, 2013; Tondeur et al., 2017). Students use social media and mobile games with ease, but they struggle with higher-order tasks. They find it hard to judge the quality of information, to create original digital artefacts, to solve problems in technology-mediated teams, and to reason ethically about data privacy (Falloon, 2020; Vuorikari et al., 2022).
This gap is structural. It comes from pedagogy, not only from curriculum content. Traditional teaching of digital competence relies on direct instruction, decontextualised skill drills, and standardised tests that reward recall over application (Tang, 2023; Trilling & Fadel, 2009). These methods do not give students the iterative practice that real competence needs: searching and appraising multiple information sources, making design decisions through negotiation with peers, troubleshooting technical problems, and reflecting on the social effects of a created artefact (Fraillon et al., 2020; Siddiq et al., 2016).
Teacher preparedness is perhaps the most acute bottleneck. Many practising teachers lack the technical competence and pedagogical confidence to lead complex digital learning activities (Howard et al., 2021; Scherer et al., 2021). As a result, ambitious policies arrive in classrooms where teachers feel underprepared, where infrastructure is uneven, and where curricular time is already over-allocated. Under these conditions, asking students to carry out complex digital activities can produce what this study terms technical barriers. This study defines technical barriers as the extraneous cognitive load that unstable tools and complex interfaces create, and that consumes the working memory students need for conceptual learning (Sweller, 1988; Makransky & Petersen, 2021).
1.1.3 The Promise and Paradox of Immersive Technology in Education
This study focuses on one emerging technology: virtual reality (VR), which offers distinctive affordances for competence development. Unlike two-dimensional screen-based learning, VR places learners in spatial environments where they can manipulate three-dimensional objects, experience changes of scale and perspective, and interact through embodied action, so that abstract concepts are grounded in perceptual experience (Makransky & Lilleholt, 2018; Makransky & Petersen, 2021). Educators have used VR effectively in many subjects: science experiments that would be dangerous or expensive in traditional laboratories (Dunnagan et al., 2020; Matovu et al., 2023), virtual exploration of historical sites in humanities education (Bekele et al., 2018), and immersive environments for language learning (Panagiotidis, 2021).
However, research on educational VR has a clear imbalance. Most studies examine students' experiences in pre-built immersive environments, such as virtual tours, simulations, and interactive narratives. These environments are designed by researchers and developers, and learners play the role of passive consumers (Radianti et al., 2020; Lui et al., 2023). Consumption-oriented VR raises situational interest, but students remain observers rather than designers of the digital experience. Active VR creation, in which students plan narratives, produce digital artefacts, and collaborate with peers, is still under-investigated.
The demands of creating VR differ sharply from those of consuming it. Consumption builds an appreciative familiarity. Creation requires planning, resource assessment, technical troubleshooting, aesthetic judgement, and collaborative coordination: the practices that DigComp 2.1 codifies as core digital competences. This study therefore takes VR not simply as a medium for delivery but as a construction kit that puts learners in the position of authors rather than audiences.
1.1.4 Reducing Technical Barriers in Collaborative VR Creation with Teacher-Mediated Assets
The main practical obstacle to collaborative VR creation in K-12 classrooms is technical rather than conceptual. In conventional digital-making activities, students face a serious technical barrier when they try to convey their creative intentions. The time and skill needed to produce even simple visual, audio, or spatial assets can tax students' cognitive resources. Little capacity is then left for the higher-order tasks that sit at the core of competence development: narrative design, aesthetic assessment, and collaborative coordination (Parong & Mayer, 2018; Sweller, 2020). This barrier helps explain why many constructionist interventions fail in under-resourced schools: students spend their effort managing unfamiliar tools instead of working on the subject matter.
This study addresses this barrier through teacher-mediated asset production. In Cycles 2 and 3, teachers used generative image and audio tools to produce themed assets, and students then selected, edited, and combined these assets into their VR storybooks. This arrangement offloaded the mechanical work of asset production, which would otherwise impose extraneous cognitive load. Students skipped the long skill-acquisition phase and could focus on the evaluative, curatorial, and collaborative parts of creating. They chose assets that served their narrative intent, negotiated aesthetic standards with peers, and combined different asset types into coherent immersive experiences. This shift moves competence development from production to evaluation, in line with DigComp 2.1's emphasis on critical, responsible, and creative technology use.
Teachers, not students, operated the generative tools (Skybox AI,Nano-Banana 2, and Jimeng). Students knew that the assets were machine-created. They used their curatorial judgement to pick assets that fit their narratives, and then assembled and edited these materials on the CLEVR platform. This teacher-mediated arrangement was a structural necessity, not a pedagogical preference. At the time of the study, commercial generative platforms required individual mobile-phone registration and login, which violated the school's management rules for underage users, and no education-specific interface with student-safe data governance was available.
Students' digital competence in this study therefore develops mainly through the process of collaborative VR creation, not through direct use of generative tools. They build these competences through curatorial reasoning (evaluating and choosing teacher-provided assets), peer negotiation (coordinating creative decisions with teammates), spatial narrative design (structuring immersive experiences), and technical troubleshooting (resolving integration problems). The teacher-provided assets support, but do not constitute, the main learning activity. The study does not isolate the effect of generative tools on learning, nor does it treat AI literacy as an outcome variable. The assessment instrument is based on the DigComp 2.1 framework, and the object of evaluation is the collaborative VR creation process.
1.1.5 Research Problem and Purpose
Five interlinked research problems motivate this study: (1) the consumption-creation asymmetry in educational VR; (2) the lack of classroom evidence on how teacher-mediated AIGC asset production can be integrated into collaborative VR creation in K-12 settings; (3) the lack of process-level evidence on how competences develop during collaborative creation; (4) the lack of evidence from diverse learner populations; and (5) the absence of actionable design principles for scaffolded VR creation. Each problem corresponds to a research gap in Table 1 (Section 1.1.6) and defines an analytic focus for the chapters that follow.
This study addresses these problems through design-based research (DBR), with three iterations in authentic Grade 7 classrooms (N = 41, 1 30, and 47). It pursues three purposes. The first is to determine whether collaborative VR creation activities build students' competences across the five DigComp dimensions, measured through pre- and post-test comparisons. The second is to identify the implementation challenges that arise when such activities enter real classrooms, such as technical barriers, collaboration breakdowns, and cognitive overload, and to examine whether the design features help students overcome these barriers. The third is to develop actionable design principles that educators can adapt to their own teaching, grounded in cross-cycle evidence rather than theoretical conjecture.
This research responds to the global policy demand for pedagogies that develop broad digital competence rather than narrow technical skills, and it provides K-12 educators with evidence-based guidance for implementing immersive technologies. It also tests whether constructionist pedagogy can succeed in ordinary schools, where time, resources, and specialist expertise are limited, when technical barriers are addressed through teacher-mediated scaffolding.
1.1.6 Systematic Research Gaps: A Gap Matrix
These five problems correspond to five interlinked research gaps. Table 1 summarises each gap, the current state of the literature, and the contribution of this study.
Each gap drives a research question or an analytic focus in the chapters that follow. Gap 1 drives the overall intervention design. Gap 2 guides the Cycle 2 redesign and the AIGC scope clarification. Gap 3 establishes the mixed-methods data architecture. Gap 4 justifies the three-cycle sampling progression. Gap 5 grounds the general discussion and the design principles in Chapter 7. In terms of the research questions: Gaps 1 and 2 motivate RQ1, Gap 3 informs the measurement design for RQ1 and RQ2a, Gap 4 frames the boundary-condition analysis for RQ2b, and Gap 5 grounds RQ2c.
Table 1
Research Gap Matrix: Current Literature and Study Contributions
Gap | Current Literature | What This Study Adds |
|---|---|---|
Gap 1: Consumption-creation asymmetry in educational VR | The vast majority of K-12 VR research examines pre-built immersive environments where students consume rather than create content (Radianti et al., 2020; Van der Meer et al., 2023). Active VR creation as a pedagogical design is under-theorised and under-evaluated. | This study designs, implements, and evaluates a collaborative VR creation intervention across three iterative cycles, generating the first systematic DBR evidence on how active VR creation develops digital competence in authentic K-12 classrooms. |
Gap 2:Teacher-mediated AIGC integration in K-12 VR contexts | Research on generative AI in education focuses predominantly on 2D text and image generation (Holmes et al., 2019). Empirical investigations of how AIGC scaffolds operate within multi-user immersive 3D environments are virtually absent (Mystakidis, 2022). | This study traces how AIGC-assisted asset generation relates to cognitive load distributions, collaboration dynamics, and competence trajectories within a shared VR authoring platform, producing design principles specific to AIGC-integrated immersive learning. |
Gap 3: Process-level evidence of competence development | Digital competence assessment relies heavily on self-report instruments and summative testing (Calvani et al., 2010). Fine-grained, action-based evidence of how competence develops during collaborative creation processes is sparse (Bakharia et al., 2016). | Partially fills: This study integrates platform log data (edit timestamps, asset selections, error events), discussion thread archives, and pre-post psychometric instruments to produce multimodal process analytics that trace competence development through observable behavioural traces. |
Gap 4: Evidence from diverse learner populations | Most VR education studies employ homogeneous, convenience samples in controlled laboratory settings (Makransky et al., 2019). Evidence on how scaffolded VR creation performs across heterogeneous school contexts and achievement levels is lacking. | Partially fills: This study tests the intervention across three cycles with a sample that first expands and then deliberately narrows (general Grade 7 population in Cycles 1-2; a high-achieving science-track group in Cycle 3), explicitly probing boundary conditions and generalisability limits. |
Gap 5: Actionable design principles for educators | Existing design guidelines for VR education focus on presence, interaction fidelity, and individual learning outcomes (Radianti et al., 2020). Actionable principles for integrating AIGC scaffolds into collaborative VR creation while preserving problem-solving demand are absent. | This study derives four actionable design principles and one provisional guideline from cross-cycle triangulation of quantitative, qualitative, and log-data evidence, offering practical guidance for educators and instructional designers. |
1.2Theoretical Foundations
This study rests on two complementary foundations: Constructionism, the learning theory that validates active creation, and DigComp 2.1, the competence framework that determines what to assess. Constructionism answers the question of why making VR content promotes learning. DigComp 2.1 answers the question of what competence dimensions to measure. Figure 1 depicts how these two foundations intersect with the pedagogical alignment of the study.
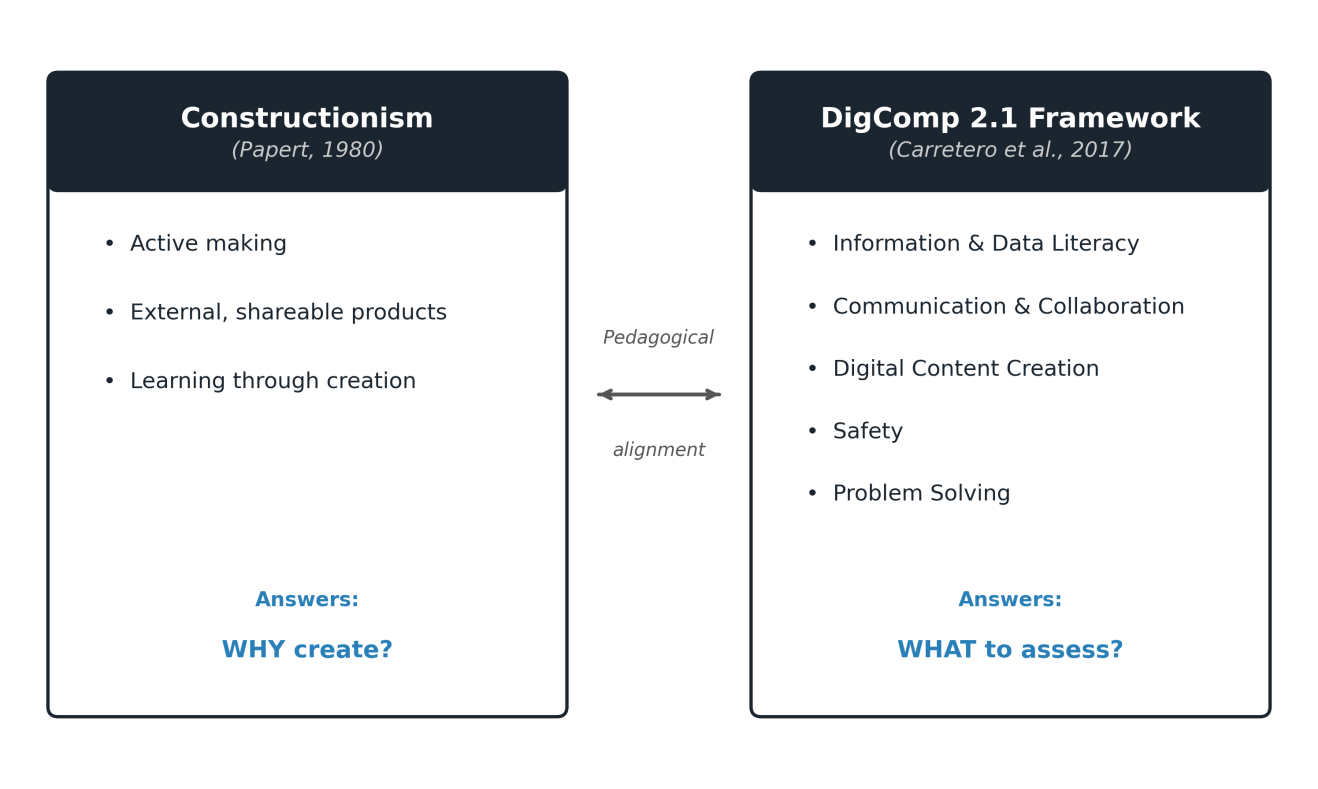
Figure 1
The Study's Two-Component Theoretical Foundation
1.2.1 Constructionism: The Pedagogical Foundation
Constructivism posits that learners construct knowledge by actively engaging with their environment (Piaget, 1952; Bruner, 1990). Constructionism builds upon this proposition. Seymour Papert (1980) argued that students learn most effectively when creating external shareable objects, either physical or digital. Engaging in the act of making makes internal thought processes visible. Peers and teachers can then provide concrete feedback.
This has direct consequences for technology-enhanced learning. Students who create digital content must plan, decide, troubleshoot, and revise, and these active processes make thinking visible and open to refinement (Papert & Harel, 1991). Constructionism thus provides the pedagogical rationale for this study's choice of intervention: collaborative VR construction requires students to build shareable immersive experiences instead of consuming pre-built environments.
1.2.2 The DigComp 2.1 Framework: The Assessment Structure
While Constructionism explains the mechanism of learning, the European Commission's Digital Competence Framework for Citizens (DigComp 2.1; Carretero et al., 2017) supplies the assessment structure. DigComp defines digital competence as "the confident, critical and responsible use of, and engagement with, digital technologies for learning, at work, and for participation in society" (Vuorikari et al., 2022). This definition is unchanged from DigComp 2.1 (Vuorikari et al., 2022).
The framework arranges digital competence into five interrelated dimensions:
• Information and Data Literacy:Searching for, evaluating and managing digital information.
• Communication and Collaboration:Interacting, sharing, and collaborating through digital technologies.
• Digital Content Creation:Creating and editing digital content.
• Safety:Protecting personal data, privacy, and well-being.
• Problem Solving:Using digital tools to solve technical and conceptual problems.
Each dimension progresses from introductory competence to eight levels of mastery (Carretero et al., 2017). This study uses the entire five dimensions as outcome indicators. The development of the students'competence is measured by a validated instrument (see Chapter 3), and also evaluated by observable behaviours in the creation cycle.
1.2.3 Collaborative VR Creation: Bridging Theory and Assessment
Collaborative VR creation links the two foundations. Through the collaborative creation of virtual environments, students act as active producers rather than passive consumers of ready-made content. Students work in groups to choose narrative storylines, create multimodal assets, and integrate them into shareable immersive environments (Radianti et al., 2020).
The creation cycle comprises four sequential stages, each drawing on different DigComp dimensions.
Phase 1:Conceptual Design. Students envision and plan their virtual environment. They agree on a theme, a shared scope, and roles. They search and analyse information resources, such as reference images, historical facts, or cultural context, to inform their design choices. They also set group norms for communication and decision-making.
Phase 2:Technical Construction. Students use VR authoring tools to create their environment. They import and edit 360-degree images, position interactive hotspots, arrange navigation paths, and embed multimedia objects. Technical glitches, such as image rendering errors, misaligned hotspots, or audio synchronisation problems, require hands-on problem solving. Students must coordinate their edits to avoid conflicts.
Phase 3:Iterative Refinement. The groups test their emerging VR environment, collect feedback, and revise their work. Students think critically about their creations against the design objectives and peer feedback. They identify remaining technical problems and solve them collaboratively.
Phase4:Presentation and Reflection. Students finalise their VR environment and present it to an audience. They check the quality of the final product, consider privacy and copyright issues, and communicate their creative and technical decisions.
Collaboration runs across all four phases. Students must coordinate their individual contributions, manage relationships with peers, and negotiate when creative ideas diverge (Hadwin et al., 2017; Liu et al., 2017). This collaborative demand turns VR creation from an individual technical procedure into a social learning space.
1.2.4 Activation Mapping: How Phases Cross Dimensions
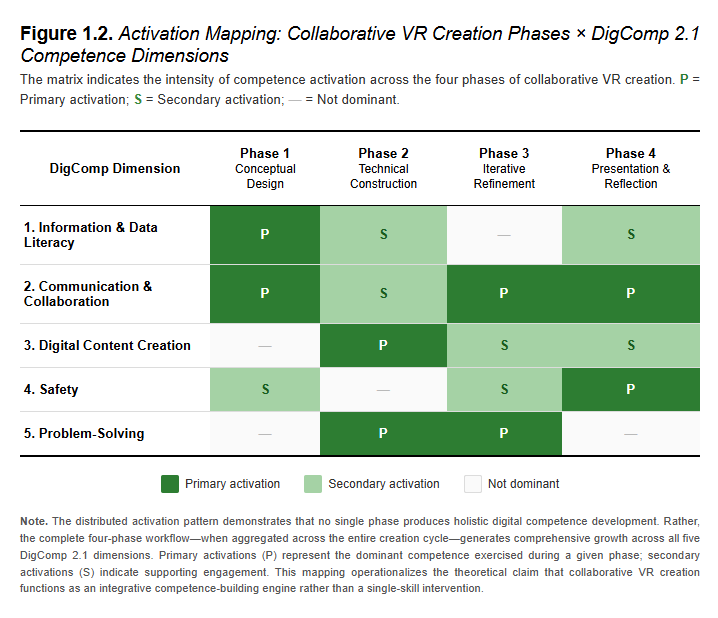
Tables 2 and 3 map the four creation phases against the five DigComp dimensions. Each cell shows the level of activation in that phase: primary (P), secondary (S), or not dominant (-). The mappings link the theoretical framework to observable design, let educators target specific dimensions, and allow verification of actual activation during the intervention.
Table 2
Primary and Secondary Activation of DigComp 2.1 Dimensions in Collaborative VR Creation (Phases 1-2)
DigComp Dimension | P1: Conceptual | P2: Technical |
|---|---|---|
1. Information & Data Literacy | P-Search, select 360° images | - |
2. Communication & Collaboration | P-Negotiate design vision | S-Coordinate edits |
3. Digital Content Creation | - | P-Crop images, configure hotspots |
4. Safety | S-Establish copyright norms | - |
5. Problem Solving | - | P-Debug rendering errors |
Note. P = Primary activation; S = Secondary activation;- = Not dominant.
Table 3
Primary and Secondary Activation of DigComp 2.1 Dimensions in Collaborative VR Creation (Phases 3-4)
DigComp Dimension | P3: Iterative | P4: Presentation |
|---|---|---|
1. Information & Data Literacy | S-Re-evaluate source quality | S-Evaluate sources |
2. Communication & Collaboration | P-Provide feedback | P-Public presentation |
3. Digital Content Creation | S-Revise content | S-Polish and export |
4. Safety | S-Review privacy settings | P-Consider copyright |
5. Problem Solving | P-Identify and resolve bugs | - |
Note. See Table 2 for abbreviations.
Two patterns emerge. First, no single phase activates all five dimensions; each phase has its own competence profile. Conceptual design draws mainly on Information and Data Literacy and Communication and Collaboration. Technical construction emphasises Digital Content Creation and Problem Solving. Iterative refinement requires giving feedback and fixing remaining bugs. Presentation demands public communication and safety awareness.
Second, no single dimension dominates every phase. Different dimensions peak in different phases: Information and Data Literacy in conceptual design, Digital Content Creation and Problem Solving in technical construction, and Safety in presentation. Communication and Collaboration is primary in three of the four phases.
For instruction, this means that students must complete all four phases to develop across all five dimensions. A task that stops at Phase 2 develops Digital Content Creation and Problem Solving, but it overlooks the communication skills practised in Phases 1 and 4, and it misses the safety awareness that Phase 4 builds through responsible content sharing. Figure 2 provides a visual summary of the activation patterns.
1.3 Research Questions
This study addresses one main question and two sub-questions:
Main Research Question: How do collaborative VR creation activities influence the development of digital competence among middle-school students, and which design elements and challenges shape that influence in authentic classrooms? In this question, design elements refer to the task, tool, and scaffolding choices that shape the learning workflow.
RQ1: What are the impacts of collaborative VR creation activities on students' digital competence across the five dimensions of the DigComp 2.1 framework?
RQ2:What implementation challenges emerge across iterative cycles (RQ2a), which design features help students overcome these difficulties (RQ2b), and what actionable design principles can guide future implementations (RQ2c)?
RQ1 is addressed through pre- and post-test comparisons on the five DigComp 2.1 dimensions (see Chapter 3). RQ2a is addressed in the cycle findings chapters (Chapters 4-6), RQ2b in the cross-cycle analysis, and RQ2c in the design principles (see Chapter 7).
1.4 Thesis Structure
This section maps the dissertation's argument chapter by chapter.
Chapter 1: Research Background.This chapter sets the context and motivation for the study: the global policy demand for K-12 digital competence, the consumption-creation asymmetry in educational VR research, the research problems and purposes, the theoretical framework combining Constructionism and DigComp 2.1, and the research questions.
Chapter 2: Literature Review.This chapter reviews the theoretical and empirical literature behind the study. It examines the debate between constructionist and direct-instruction approaches, traces the DigComp framework and its operationalisation for VR creation, and surveys evidence on maker education, collaborative learning, VR creation, technical scaffolding, and learning analytics. The chapter concludes with five research gaps that motivate the study.
Chapter 3: Research Design and Methods.This chapter presents design-based research (DBR) as the methodology and explains the three-cycle intervention structure, the participants, and the institutional context. It describes the multimodal data architecture, comprising a validated digital competence instrument, interaction logging on the CLEVR platform, and focus group interviews, and specifies the quantitative, qualitative, and process analytics used to integrate the data strands.
Chapter 4: Cycle 1 Findings: The Baseline and Technical Barriers.This chapter reports the first DBR cycle, a baseline intervention without teacher-mediated asset support. It identifies the technical barriers that dominated the student experience, analyses the failure cases in detail, and derives the design modifications for Cycle 2.
Chapter 5: Cycle 2 Findings: Teacher-Mediated Asset Support and the Redesigned Intervention.This chapter examines the second cycle, which replaced manual panoramic capture with teacher-produced assets to reduce technical barriers. It presents the quantitative results from the larger sample (N = 1 30), introduces the process analytics framework with three typical groups, and triangulates log data with focus group interviews to answer RQ1 and RQ2.
Chapter 6: Cycle 3 Findings: Testing with a High-Achieving Cohort.This chapter analyses the third cycle, which tested a more complex multimodal task with a high-achieving science-track subsample (N = 47). It details the problem analysis, the design refinement, and the quantitative and qualitative findings.
Chapter 7: General Discussion and Design Principles.This chapter synthesises findings across the three cycles and offers four design principles for immersive learning in schools: reduce technical barriers before introducing cognitive challenge; scaffold genuine collaboration through structurally interdependent tasks; calibrate AIGC assistance to preserve problem-solving demand; and use dominant challenges as a pedagogical pivot, not an obstacle.
The appendices provide a glossary (A), the design decision log and implementation timeline (B), the coding scheme (C), the statistical and psychometric output (D), and the curriculum materials (E).
Chapter 2: Literature Review
This chapter reviews the literature that motivates both research questions. It asks when and how creation-based pedagogy in immersive environments can generate measurable competence gains, and how teacher-mediated scaffolds shape this process. Across these bodies of work, one asymmetry recurs: most educational VR research examines students' consumption of pre-built environments, while active creation is under-evaluated.
The review moves from theory to evidence to method. Section 2.1 examines the debate between constructionist and direct-instruction positions and derives the scaffolded-creation stance of this study. Section 2.2 defines the outcome variable through the DigComp 2.1 framework and its operationalisation for collaborative VR creation. Sections 2.3 and 2.4 position VR creation within maker education and immersive-technology research, and examine the evidence on how VR creation develops each DigComp dimension. Section 2.5 reviews technical scaffolding and the expertise reversal effect, which together inform the three-cycle design. Section 2.6 turns to method: how learning analytics can trace competence development in collaborative digital work. Section 2.7 synthesises the review into the research gaps that this study addresses.
2.1 Theoretical Foundations
This section explores the learning theory behind the pedagogical design of the study. It starts with the constructivist-constructionist position that active making builds more profound competence than passive consumption (Section 2.1.1). It then engages the direct-instruction critique that unguided construction is inefficient for novice learners (Section 2.1.2). Finally, it shows how structured scaffolding can bridge this divide, keeping the opportunity for creation while removing unnecessary complexity, a standpoint that orients the intervention design without bringing in additional theoretical machinery (Section 2.1.3).
2.1.1 The Constructivist-Constructionist Position
The key debate is whether learners build deeper and more transferable competence when they actively construct knowledge and create shareable artefacts, compared with being passive recipients of information. Constructivists claim that learning is an active process of making meaning. Individuals constantly use existing cognitive schemas to interpret new experiences and resolve conflicts (Piaget, 1952; Bruner, 1990; Phillips, 1995). Constructionism extends this logic. It holds that creating external artefacts exposes the learner's thinking to peers, who can provide feedback and guide further iterations (Papert, 1980; Papert & Harel, 1991). Translated into technology-enhanced contexts, this view gives rise to student-centred environments in which collaborative problem solving and maker activities take the place of didactic lessons (Blikstein, 2013; Dillenbourg, 1999; Gokhale, 1995; Halverson & Sheridan, 2014). Recent VR creation studies support this view: collaborative immersive environments with well-designed scaffolding promote meaning-making and student agency (Jensen & Konradsen, 2018; Papavlasopoulou et al., 2019; Silseth et al., 2024).
While Piaget focused on internal cognitive structures, Papert emphasised the external environment. Constructionism holds that learners learn most effectively when they actively create tangible, shareable artefacts in the real world. Whether building a physical robot, programming a digital game, or creating a 3D virtual museum, the process of making reveals internal thinking processes, making them visible to peers and teachers, who can provide immediate feedback. This theory explains why education must go beyond absorbing information from textbooks and move towards active digital fabrication. Three constructionist principles shape the intervention design of this study. First, active learning: immersive VR tasks require students to manipulate digital tools actively rather than watch simulations passively (Mikropoulos & Natsis, 2011). Second, collaboration: VR activities require students to co-design the virtual environment and negotiate creative decisions in real time. Third, artefact creation: students apply theoretical knowledge to authentic design problems and publish a shareable digital world. Recent studies confirm these mechanisms in virtual environments. Silseth et al. (2024) report that collaborative VR experiences strengthen students' meaning-making. By sharing and creating in digital spaces, learners actively co-construct knowledge through dialogue and iterative artefact creation (Jensen & Konradsen, 2018; Papavlasopoulou et al., 2019). However, immersive technology alone does not ensure active learning; teachers must lead the educational dialogue and support students as they make meaning (Silseth et al., 2024). Effective VR creation activities call for careful pedagogical mediation alongside the technology itself (Chang et al., 2023).
2.1.2 The Direct-Instruction Critique
Against this position, some researchers claim that unguided or minimally guided construction is inefficient for novice learners. Kirschner, Sweller, and Clark (2006) argue that minimal guidance neglects the limits of working memory. Novice learners lack the schemas needed to manage open-ended discovery tasks and risk cognitive overload. Mayer (2004) found that pure discovery learning typically produces poorer results than guided instruction because learners invest resources in ineffective trial and error. From this perspective, the very features that render constructionism attractive (open goals, multiple solution routes, learner autonomy) become generators of cognitive chaos that obstruct learning. The critique also has practical force. In real K-12 classrooms, teachers and students face practical constraints: limited time, heterogeneous preparation, and limited technical expertise among teachers. In collaborative VR creation, complex tasks with powerful tools but inadequate support lead to frustration rather than learning. Students spend their energy understanding software interfaces and never engage with the subject matter. The direct-instruction camp argues that this is not an implementation failure but a structural one: a pedagogy mismatched to the population. This study takes this critique seriously. It does not dismiss the direct-instruction evidence as irrelevant or methodologically flawed. Instead, it asks two questions. What conditions can make constructionist pedagogy work in K-12? What scaffolding structures can preserve the benefits of active creation while managing the risk of cognitive overload? These two questions guide the intervention design and the analytic framework.
2.1.3 From Debate to Design: Scaffolded Creation
This study navigates the tension between constructionism and direct instruction through structured scaffolding. The intervention uses an optimised onboarding workflow, with teacher-mediated asset production and pedagogical checklists, to retain the possibilities of creation while removing redundant complexity. The aim is to keep the constructionist act of making active while answering the direct-instruction critique.
Collaborative VR creation inherently involves implementation challenges: technical barriers when students handle unfamiliar tools, communication difficulties when they coordinate in a shared virtual environment, and coordination demands when they make creative decisions. This study treats these challenges not as theoretical constructs that need frameworks of their own, but as design parameters to be calibrated through scaffolding. The DBR methodology provides the framework for this calibration: each cycle tests whether the current level of scaffolding is sufficient, excessive, or misplaced, and the next cycle adjusts accordingly.
Chapter 4 presents how these challenges emerged in Cycle 1, how Cycle 2 was redesigned to address them, and how students developed productive collaboration once task demands were calibrated to their capabilities. The cross-cycle evidence informs four design principles that bridge theory and practice: reduce technical barriers before introducing cognitive challenge; scaffold genuine collaboration through structurally interdependent tasks; calibrate AIGC assistance to preserve problem-solving demand; and use dominant challenges as a pedagogical pivot, not an obstacle.
2.2 Digital Competence in STEM Education
The learning theories in Section 2.1 provide the basis for understanding how students build digital competence in K-12 STEM education. This section defines the competence framework of the study (Section 2.2.1), reviews age-related developmental pathways (Section 2.2.2), and examines the systemic challenges of implementation (Section 2.2.3).
2.2.1 The DigComp Framework: Evolution and Operationalisation
Digital competence is a precondition for participation in contemporary society, and the European Commission has defined it as one of eight key competences for lifelong learning (Ferrari, 2013). The Digital Competence Framework for Citizens (DigComp) provides the conceptual structure for this competence (Vuorikari et al., 2016; Carretero et al., 2017). This study adopts DigComp 2.1 (Carretero et al., 2017) as its assessment framework. Its five dimensions anchor the CLEVR platform indicators and the assessment instrument (Table 4), and the quantitative analyses in Chapters 4 to 6 are tied to DigComp 2.1 descriptors. Retaining this version is a matter of methodological consistency, not a claim about its currency.
DigComp 2.2 (Vuorikari et al., 2022) retained the five-area structure, the twenty-one competences, and the eight-level proficiency scale. Its update was to the examples of knowledge, skills and attitudes, which now cover contemporary practices such as misinformation, data-related skills, and early generative AI use. DigComp 3.0 (Cosgrove & Cachia, 2025) goes further: AI competence is presented as a transversal layer across the twenty-one competences of the five areas, organised around four integration modes: understanding AI systems, using AI tools critically, evaluating AI-generated content, and creating with AI while preserving human agency. This structure suggests that AI literacy is increasingly treated as integral to all five competence areas (Long & Magerko, 2020).
This evolution has two implications for this study. First, the instrument was designed against DigComp 2.1 descriptors and does not isolate AI-specific items. The measured results may therefore underestimate student development in an AI-mediated creation environment, where competences such as evaluating AI-generated content and creating with AI are not separately captured. This is a recognised limitation rather than a methodological flaw: the study was conceived before the release of DigComp 3.0, and retroactive changes would undermine the instrument's validated psychometric properties. Second, the design principle "calibrate AIGC assistance to preserve problem-solving demand" (Chapter 7) finds direct support in DigComp 3.0's emphasis on human-AI collaboration over replacement, including its caution against competence erosion when learners hand cognitive tasks to AI without retaining evaluative oversight.
Information and Data Literacy
DigComp 2.1 defines this as the capacity to articulate information needs, to locate and retrieve digital data, information and content, and to judge the relevance of the source and its content (Carretero et al., 2017). Collaborative VR creation engages this competence when students identify, evaluate, and select 360-degree panoramic images, ambient audio, and reference materials for their shared environments, weighing resolution, licensing status, and relevance to the topic.
Communication and Collaboration
DigComp 2.1 defines this as the capacity to interact, communicate and collaborate through digital technologies while being aware of cultural and generational diversity, to participate in society through digital services, and to manage one's digital identity and reputation (Carretero et al., 2017). VR creation requires this competence when students negotiate a shared design vision, coordinate concurrent edits, and resolve disagreements over spatial layout or narrative sequencing in a shared multi-user workspace.
Digital Content Creation
DigComp 2.1 defines this as the capacity to create and edit digital content, to integrate and re-elaborate previous knowledge and content, and "to understand how copyright and licences apply to data, information and digital content" (Carretero et al., 2017). VR creation exercises this competence when students integrate and refine multiple media streams, such as 360-degree images, spatial audio, narration tracks, and interactive hotspots, into a coherent immersive narrative.
Safety
DigComp 2.1 defines this as the capacity to protect devices, personal data and privacy in digital environments, to protect physical and psychological health, and to be aware of digital technologies for social well-being and social inclusion (Carretero et al., 2017). VR creation invokes this competence when students verify copyright and licensing terms for external assets, apply appropriate attribution, and manage access permissions for their collaborative workspaces.
Problem-Solving
DigComp 2.1 defines this as the capacity to identify needs and problems, to resolve conceptual problems and problem situations in digital environments, and to use digital tools to innovate processes and products (Carretero et al., 2017). VR creation engages this competence when students diagnose technical failures, such as rendering errors, misaligned hotspots, or synchronisation conflicts, test candidate solutions, and iterate towards functional outcomes.
Table 4 maps each dimension to the creation phases, activation scenarios, and observable indicators captured in CLEVR platform logs and discussion archives.
Table 4
Mapping of DigComp Dimensions to VR Creation Phases and Observable Indicators
DigComp Dimension | VR Creation Phase (s) | Activation Scenario | Observable Indicator(s) | Theoretical Anchor |
|---|---|---|---|---|
1. Information & Data Literacy | Conceptual Design; Technical Construction | Students search, evaluate, select, and integrate 360° images, audio, and multimedia assets for shared scenes | Search query diversity; source citation frequency; image replacement count; dwell time on asset previews | Constructivism (information negotiation); Pangrazio & Sefton-Green, 2021 |
2. Communication & Collaboration | Conceptual Design; Iterative Refinement; Presentation | Students negotiate design visions, coordinate concurrent editing, and resolve spatial/narrative disagreements in multi-user workspace | Discussion thread frequency; response latency; turn-taking patterns in edit logs; semantic markers in chat (suggestion/feedback/conflict/consensus) | Constructionism (knowledge as social artefact); Hadwin et al., 2017 |
3. Digital Content Creation | Technical Construction; Iterative Refinement | Students assemble, synchronize, and refine 360° images, audio, hotspots into coherent immersive narratives | Hotspot density per scene; audio placement accuracy; revision cycle count; media type diversity per project | Constructionism (learning through creating shareable objects); Ilomäki et al., 2016 |
4. Safety | Conceptual Design; Presentation | Students verify copyright/licences, determine attribution, and configure workspace access permissions | Copyright verification clicks; attribution annotations; privacy setting adjustments | Livingstone et al., 2015; Vuorikari et al., 2022 |
5. Problem-Solving | Technical Construction; Iterative Refinement | Students diagnose and resolve rendering errors, misaligned hotspots, broken links, and synchronisation conflicts | Debugging event frequency; time-to-resolution; iterative attempt count; alternative strategy adoption | Scaffolded learning design (managing task demands); Yadav et al., 2016; Wing, 2006 |
Note. P = primary activation phase; S = secondary activation phase. Observable indicators are extracted from CLEVR platform system logs and discussion thread archives. AIGC extension annotations indicate how DigComp 3.0's transversal AI competence reframes the activation scenario and observable indicators for this study's scaffolded intervention cycles (Cycle s 2 and 3).
Critical Tensions in Framework Selection
The translation of DigComp 2.1 into collaborative VR creation is itself contested. Advocates value the framework's broad coverage and its open architecture, which supports contextual adaptation across national boundaries (Redecker, 2017; Vuorikari et al., 2022). Critics note that the framework was developed primarily with adult European citizens in mind and lacks validated developmental progressions for K-12 students (Carretero et al., 2017). A further line of critique argues that the five-dimension architecture underrepresents the collaborative regulation and spatial reasoning that multi-user VR environments demand, competences that constructionist scholars regard as central, not peripheral, to digital making. Cross-cultural analysis sharpens the concern. China's 2022 Information Technology Curriculum Standards (Ministry of Education of the People's Republic of China, 2022) emphasise computational thinking, digital innovation, and information social responsibility, constructs that only partially overlap with DigComp's five dimensions. The ISTE Standards for Students prioritise creative communication and computational thinking (ISTE, 2016), while UNESCO's ICT Competency Framework for Teachers prioritises pedagogical integration (UNESCO, 2022). DigComp 2.2 added AI-related examples but did not designate AI as a separate competence area; emerging scholarship argues that collaborative VR creation increasingly requires AI-related skills such as prompt engineering, synthetic media evaluation, and algorithmic bias detection (Van Audenhove et al., 2024; Tiernan et al., 2023).
This study therefore adopts DigComp 2.1 not as a self-evident universal taxonomy, but as an interpretive framework whose limits are tested through CLEVR-based operationalisation with Chinese K-12 students. The study thereby tests whether DigComp descriptors adequately capture the digital demands of collaborative VR creation in Chinese K-12 STEM classrooms. If the 2.1-based instrument detects competence change in an AIGC-integrated environment, the framework shows contextual adaptability beyond its original design parameters; if it cannot capture AI-specific development, the findings will support calls for DigComp 3.0-aligned instruments in future research.
2.2.2 Developmental Pathways in K-12 STEM Contexts
The development of digital competence follows age-related pathways, and these pathways influence how educators scaffold K-12 VR creation. Elementary students focus on foundational technical operations and online safety guidelines (Li & Ranieri, 2010). Middle school students strengthen their information literacy, question source validity, and begin to grapple with digital ethics (Hatlevik et al., 2018); middle school classrooms also introduce collaborative digital environments, preparing students for the multi-user coordination that collaborative VR creation requires. High school students show more advanced digital maturity: they initiate long-term digital projects, use sophisticated software, and express critical awareness of technology's role in society (Ferrari, 2013; Vuorikari et al., 2016).
This trajectory suggests that middle and high school are appropriate levels for collaborative VR creation: students have sufficient foundational competence to meet the technical and collaborative demands, yet still benefit from scaffolded challenge. Age is nevertheless an imperfect predictor of digital competence, given differences in socioeconomic status and access to technology inside and outside school (Reich, 2020; Scherer et al., 2021). This study recruited students from one school in Dongguan, China (see Chapter 3). The findings therefore come from a single school context. Section 3.8 treats generalisability across schools as a limitation.
2.2.3 Current State, Assessment, and Systemic Challenges
Assessing these competences requires approaches beyond standardised testing. Digital portfolios capture the iterative process of artefact creation and support peer review and self-reflection (Lui et al., 2020), and assessment frameworks must align with applicable curriculum objectives (Calvani et al., 2010).
Implementation barriers are substantial in K-12 education. Inequalities in access to technology persist, and disparities between urban and rural schools are still a reality (Tondeur et al., 2012). Curriculum integration often fails because policymakers add requirements without giving teachers sufficient training and long-term institutional support (Ertmer & Ottenbreit-Leftwich, 2010). Successful integration requires systemic approaches that address organisational change at every level, from individual teacher beliefs to institutional infrastructure (Tondeur et al., 2017).
Teacher Preparedness and Technical Challenges
Teacher preparedness is the most significant obstacle. Many teachers lack the technical skills to lead advanced digital education (Howard et al., 2021; Scherer et al., 2021). Studies also report wide disparities in motivation and self-efficacy for digital media use among educators (Fraillon et al., 2020), and student outcomes are conditioned by teacher skill (König et al., 2020). Frameworks such as DigCompEdu give educators a goal-oriented way to assess their competences (Redecker, 2017; Tondeur et al., 2023).
The Digital Divide and Equity Concern s
Systemic inequalities compound teacher preparedness. The digital divide goes beyond device access: it covers the quality of internet connections, technical expertise, and classroom integration (Scherer et al., 2021). Students from lower socioeconomic backgrounds may receive devices without experiencing meaningful digital learning opportunities (Reich, 2020). These disparities are critical for collaborative digital creation, where continuous connectivity and reliable hardware determine whether students can participate at all.
Technical Challenges as a Pedagogical Impediment
This widespread unpreparedness creates a pedagogical bottleneck. When classrooms take on advanced digital tasks such as collaborative VR artefact creation, a lack of technical fluency consumes the cognitive resources that could otherwise support STEM learning. This barrier (Section 1.1.4) interferes with the higher-order goals defined in DigComp, such as Digital Content Creation and Problem Solving (Vuorikari et al., 2022), and reducing it requires careful instructional design that balances technological complexity against pedagogical goals (Howard et al., 2021).
The field disagrees on how to handle this tension. A cognitive-load perspective argues that complex digital tasks exceed the capabilities of under-trained teachers and students, so reducing technological complexity should come before ambitious pedagogical targets (Ertmer & Ottenbreit-Leftwich, 2010; Howard et al., 2021). An integrative perspective, rooted in constructionist and systemic-change traditions, counters that removing technical challenges can also remove learning opportunities: sustained interaction with complex technologies builds transferable digital skills, whereas simplified tools restrict students to procedural acts (Blikstein, 2013; Tondeur et al., 2017). This study traverses the conflict through graduated scaffolds in CLEVR, such as streamlined onboarding workflows that retain advanced creation features, and examines whether friction reduction and higher-order competence growth can be achieved concurrently in K-12 STEM settings.
2.3 Maker Activities
2.3.1 Learning by Making
Maker activities originate from the global Maker movement, which integrates practical learning, inventing, and technology into the classroom (Halverson & Sheridan, 2014). Students carry out hands-on projects such as robotics, 3D printing, and digital crafting, and the growing availability of digital tools gives more students access to these creative experiences (Blikstein, 2013).
Making does more than develop technical ability. Real-world maker projects engage students in computational thinking as they develop solutions to complex, open-ended challenges with digital tools (Yin et al., 2020). In this process, knowledge is externalised: ideas become tangible products that connect theory to practice (Kafai & Burke, 2014; Papavlasopoulou et al., 2017). Maker activities also train cooperation. In group projects, students learn to communicate effectively, take ownership of their assignments, and reflect critically on outcomes (Oswald & Zhao, 2021).
2.3.2 Collaboration in Maker Learning
Collaborative learning holds that students gain knowledge through social interaction rather than independent work (Johnson & Johnson, 2009; Dillenbourg, 1999). Working together, students solve problems, achieve shared understanding, and develop new ideas; the social pressure of group work pushes them to structure and examine their own thinking (Gokhale, 1995; Resta & Laferrière, 2007). Digital tools extend this process, allowing students to exchange information and co-construct projects in real time regardless of location (So & Brush, 2008), and immersive platforms such as VR open further possibilities for real-time co-creation (Radianti et al., 2020; Mystakidis, 2022).
What counts as authentic collaboration is nevertheless contested. Johnson and Johnson's (2009) Social Interdependence Theory holds that genuine collaboration requires five elements: positive interdependence, individual accountability, promotive interaction, social skills, and group processing. Group work without these structured elements, in their view, amounts to pseudo-collaboration. Dillenbourg's (1999) CSCL framework instead treats collaboration as a continuum from division of labour to deep collaboration: situated, emergent, and technologically mediated. Later work warns that over-structuring collaboration can inhibit spontaneous knowledge building (Dillenbourg, 2013). Stahl (2006) further shows that group cognition can exceed the sum of individual contributions through emergent collective processes that structural rubrics cannot capture. This study treats the tension between designed interdependence and emergent coordination as an empirical question: across the DBR cycles, the intensity of collaboration scaffolding is varied to examine whether structured roles and workflow prompts improve or restrict the collaborative dynamics of K-12 students in VR creation.
2.3.3 Scaffolding under Technical Complexity
Maker education resists rigid pedagogy: its exploratory nature requires what Papert calls bricolage, and excessive scaffolding reduces creative risk-taking and shifts ownership from learners to the curriculum (Blikstein, 2013; Peppler & Bender, 2013; Halverson & Sheridan, 2014). Yet unstructured maker projects often disintegrate under technical complexity, leaving students frustrated (Chu et al., 2015; Martin, 2015; Sweller et al., 2019). From this perspective, scaffolding does not hinder creativity; it distributes cognition so that novices can reach levels of performance they could not reach unaided (Vygotsky, 1978; Pea, 2004). Effective scaffolding in maker settings therefore supports technical skill and team coordination simultaneously (Peppler & Bender, 2013), for example through explicit role assignments, reflection protocols, and design documentation (Martin, 2015).
These demands intensify in digital and immersive environments. Learning new software interfaces imposes cognitive load, and students must handle technical tools and collaboration at the same time (Al-Samarraie & Saeed, 2018; Sweller et al., 2019; Radianti et al., 2020). Without proper scaffolding, the technical complexity of digital fabrication tools overwhelms novice learners, and frustration can push students out of the collaborative process (Blikstein & Worsley, 2016). Scaffolds for immersive maker activities must therefore integrate technical learning with collaboration support and balance creative freedom against the assistance students need. This balance is what the CLEVR-based intervention is designed to test.
2.4 VR Creation Activities in Education
2.4.1 From Passive Consumption to Collaborative Creation: The Evolution of VR in Educational Contexts
VR has moved from expensive military and industrial training systems to affordable educational tools (Merchant et al., 2014). Early educational VR treated students as passive recipients of ready-made virtual material: students could tour simulated historical sites or visualise scientific phenomena, but they could not build content of their own (Radianti et al., 2020). This consumption-based approach gives students vivid visual material, yet it confines them to observation rather than creation.
Pedagogical theory demands more active participation. Constructivism holds that durable learning occurs when students construct their own knowledge through hands-on activity rather than passive reception (Bruner, 1990). Constructionism extends this argument: learning is most effective when knowledge construction leads to external, shareable artefacts (Papert & Harel, 1991). Together with rapid innovation in VR authoring tools, these theories have fuelled the transition from VR consumption to VR creation in education (Papanastasiou et al., 2019). Recent advances in generative AI have accelerated this transition (Cosgrove & Cachia, 2025).
VR creation platforms have become more accessible, and this trend accelerates the transition. Current authoring tools let students design, build, and share virtual spaces without advanced programming knowledge (Liu et al., 2017). Modern platforms also support collaborative features: multiple students can co-edit the same virtual space in real time, so VR creation changes from a technical one-person show into a social learning setting that mirrors professional collaboration (Jenkins et al., 2016). Collaborative authoring tools now allow students to create interactive VR content together in real time (Coelho et al., 2019), opening creative possibilities beyond traditional 2D media (Herman & Hutka, 2019).
Collaboration changes the learning value of creation. Social exchange, peer feedback, resource sharing, and co-authorship directly affect students' engagement and learning outcomes (Radianti et al., 2020). Reviews of immersive VR in education associate collaborative creation with higher engagement and ownership than consumption-oriented use (Checa & Bustillo, 2020; Pellas et al., 2021). Southgate et al. (2022) documented this pattern directly: secondary students who created a 360-degree VR science resource for younger pupils showed strong engagement, and their creation work was assessed at high quality. Collaborative VR environments also support peer learning: students can watch each other's creation processes in real time (Mystakidis, 2022).
These opportunities come with real challenges. The technical complexity of VR authoring tools imposes cognitive load on novice learners and can interrupt creative flow (Sweller et al., 2019). Collaborative creation also raises classroom-management demands: teachers must support individual technical learning and group dynamics at the same time (Howard et al., 2021). Task design should therefore sequence technical demands so that they do not crowd out creative and collaborative goals (Howard et al., 2021).
2.4.2 Educational Benefits of Student VR Creation Activities
Collaborative VR creation turns individual technical practice into social learning. When several students co-edit a shared virtual space, they must coordinate design visions, test conflicting perspectives, and develop shared ownership of the creative outcome (Que et al., 2025). Unlike asynchronous collaboration, concurrent spatial editing requires real-time communication, and each decision has an immediate, visible impact on the group product. These conditions resemble high-stakes coordination in professional teamwork (Pellas et al., 2021). This benefit maps onto the DigComp Communication and Collaboration dimension: students practise digital communication, conflict resolution, and cooperative planning in a technology-mediated environment, skills also demanded in digitally mediated workplaces (Vuorikari et al., 2022). The impact of VR creation on the other DigComp dimensions is analysed in Section 2.4.4.
2.4.3 Collaborative VR Creation Activities: Dynamics and Tools
Participatory Design and Multi-Stakeholder Collaboration
Participatory design with end-users improves the usability of VR products (Muñoz et al., 2022), a principle this study applies to K-12 task design.
Collaboration Patterns in K-12 Learning Environments (The CLEVR Platform)
Recent evidence from the CLEVR (Collaborative Learning Environments in Virtual Reality) platform shows how secondary students interact during VR creation. Que et al. (2025) compared collaboration patterns in high-performing and low-performing groups and found a relationship between a group's collaboration style and the quality of its final 3D artefact. High-performing groups produced content more frequently, updated each other's contributions, communicated readily with teammates, and approached difficulties proactively by seeking help. Low-performing groups showed less agency: their communication stalled at the discussion level, execution lagged, coordination broke down, and their final artefacts were weaker. These differences point to where AI scaffolds could intervene to support struggling teams. These studies were conducted by the laboratory that developed CLEVR and are reported here as platform documentation (see Section 3.4.2 for the full disclosure).
Technological Tools Supporting Collaboration
Collaborative VR creation requires a reliable backend infrastructure. Platforms such as CLEVR support group coordination through real-time awareness of peer activities (Z. Wang et al., 2024). Version control mechanisms such as VRGit allow students with divergent perspectives to work simultaneously in the same virtual space without overwriting each other's contributions, reducing editing conflicts (Zhang et al., 2023). By automating group management, these tools reduce extraneous cognitive load and free students to concentrate on creative work. A structured orientation process also helps newcomers to virtual worlds engage meaningfully, so onboarding time should be planned as part of the intervention (Christopoulos et al., 2018).
Such infrastructure is nevertheless contested. Proponents argue that group awareness and version control act as distributed cognitive scaffolds that remove coordination overhead (Zhang et al., 2023, 2024; X. Wang et al., 2023; Z. Wang et al., 2024). Critics warn that each additional layer brings a new learning curve: tools added to help become extra objects to learn (Sweller et al., 2019; Howard et al., 2021). Students may then face a double bind, having to learn 3D authoring and a complex collaboration system at the same time.
Summary: Technical Challenges and Future Directions
Collaborative VR creation opens a multidimensional pathway: students develop STEM knowledge and digital competence concurrently. Yet the process inherits a serious challenge. K-12 students face steep learning curves in 3D modelling and complex software navigation, cognitive load rises, and creative flow is interrupted. Needs analyses show that students need extensive support in progress monitoring, reflection, and tailored feedback during VR content creation (Ng et al., 2022).
Traditional teaching methods cannot remove this friction in real time. Future interventions will need more adaptive and intelligent support systems. Tools that integrate generative AI into immersive authoring, such as teacher-mediated 3D layout support, can serve as cognitive scaffolds that reduce technical barriers while preserving user agency (Zhang et al., 2024). Ensuring equitable access to such AI-supported tools for all learners is a critical issue for educational design research.
2.4.4 Impact of VR Creation Activities on Digital Competence
To impose analytical order on this heterogeneous literature, Table 5 organises the evidence in two tiers. Panel A lists synthesis-level reviews and meta-analyses. Panel B lists empirical studies in which learners actively constructed immersive content. Two features of this evidence base matter for the present study. First, synthesis-level evidence is abundant, but empirical studies of learner-led immersive creation in authentic school classrooms remain scarce. Second, collaborative creation of 3D worlds in K-12 is almost unstudied. The present study addresses both gaps.
Table 5
Evidence on Immersive Content Creation and Digital Competence: Syntheses and Empirical Studies
Panel A. Synthesis-level evidence
Study | Type | Focus |
|---|---|---|
Checa & Bustillo (2020) | Review | Immersive VR serious games for learning and training |
Pellas et al. (2021) | Systematic review | A decade of immersive VR in K-12 and higher education |
Papanastasiou et al. (2019) | Review | VR/AR effects on students' twenty-first century skills |
Papavlasopoulou et al. (2017) | Literature review | Empirical studies of the maker movement |
Sun et al. (2021) | Meta-analysis | Programming activity design for K-12 computational thinking |
Panel B. Empirical studies of learner-led immersive creation
Study | Type | Focus |
|---|---|---|
Southgate et al. (2022) | Secondary school, Australia | Students aged 13-14 created a 360-degree VR science learning resource for primary pupils |
Que et al. (2025) † | Secondary school, Hong Kong | Small-group 3D world co-creation on the CLEVR platform |
Note. † Platform-development study conducted by the research team (see disclosure in Section 3.4.2).
Impact on Information and Data Literacy
Information literacy competences are sharpened through VR creation. The asset acquisition phase of VR creation forces students to weigh several criteria at once, including technical quality, educational fit, and copyright compliance. These demands exceed those of an ordinary web search (Pangrazio & Sefton-Green, 2021).
With AIGC support tools in the search process, attention shifts from the manual hunt for sources to careful credibility evaluation. AI-supported search scaffolding absorbs the mechanical work of source identification and filtering, and students can turn to the complex information handling that marks high digital competence. Such gains depend on scaffold design: when AI tools replace student judgement rather than support it, students can develop dependency instead of competence.
Critical digital literacy scholarship complicates this picture. Much production-focused digital work trains procedural search skills rather than critical epistemic skills: students learn to retrieve assets efficiently, but not necessarily to interrogate the ideological or evidentiary basis of those sources (Pangrazio & Sefton-Green, 2021). Students may also adopt surface credibility heuristics, such as publication date or web domain, while neglecting deeper checks of information power and bias (Metzger et al., 2010). Even the evaluation tasks used by Christopoulos et al. (2018) may reward procedural accuracy over critical reflexivity. Whether VR creation triggers genuine information literacy, or simply a faster and more motivated form of searching,is an open question.
Impact on Communication and Collaboration
Collaborative VR learning environments strengthen teamwork and communication competences. Evidence from a systematic review indicates that co-designing in immersive environments elicits sophisticated coordination strategies, including role specialisation and conflict resolution because simultaneous spatial editing makes every individual decision visible in the group outcome (Pellas et al., 2021; Que et al., 2025). Mystakidis (2022) likewise argues that immersive collaboration mirrors professional teamwork, giving students a rehearsal space for technology-mediated workplace communication.
The mediating role of pedagogical design is decisive here. When task structures create real interdependence, so that each student's contribution is needed for the group's success, students initiate the improvisational, responsive communication patterns typical of effective teams (Sawyer, 2003). Workflow-guided task allocation can support this process by defining roles and reducing coordination overhead, so that students shift their attention from negotiating procedures to substantive creative dialogue. Without such scaffolds, the same coordination overheads can lead to conflict, social loafing, and withdrawal.
Whether these gains transfer to face-to-face settings is contested. Immersive environments remove many non-verbal cues and co-presence markers that support spontaneous coordination (Howard et al., 2021), and technology-mediated collaboration can fail through over-scripting or under-scripting (Dillenbourg & Jermann, 2007). Que et al. (2025) found that low-performing VR groups often disintegrated into discursive confusion without actual coordination. The collaboration competences gained in virtual spaces may therefore be narrower than platform advocates assume.
Impact on Digital Content Creation
The impact on digital content creation is the most direct and best documented. Reviews of VR and AR in education associate creation-based use with gains in digital production skills, including multimedia and interface design (Papanastasiou et al., 2019). Conceptual work on digital competence describes the same shift: as students move from consuming content to producing it, their relationship with digital technology changes, and creative agency expands (Ilomäki et al., 2016).
Evidence of production, however, is not evidence of competence. Students in maker environments often acquire tool fluency, that is, prompt and confident control of software, without the aesthetic judgement, narrative coherence, or user-centred design thinking that define expert digital creators (Papavlasopoulou et al., 2017). Most of the reviewed studies assess the quantity of production, such as the number of assets created or scenes assembled, rather than its quality, such as design rationale or depth of iterative refinement. Kafai and Burke (2014) warn that the maker movement's enthusiasm for celebrating making can produce "making without learning".
Teacher-mediated asset scaffolds can amplify the impact by absorbing production overheads such as format conversion, spatial alignment, and rendering optimisation. Freed cognitive resources can then serve higher-order creative decisions: media sequencing, narrative pacing, and pedagogical design. The shift works only when the scaffold redistributes the task rather than replaces it. Students must still exercise curatorial judgement over AI-generated assets, deciding which outputs meet quality standards and how to integrate them into coherent narratives. This evaluative oversight preserves the creative decision-making that drives competence development.
Impact on Safety
Safety competence is strengthened when students encounter authentic digital safety dilemmas in meaningful production contexts. Livingstone et al. (2015) showed that children's digital safety practices develop in the context of everyday, situated device use at home rather than through abstract rules alone. In VR creation, students grapple with real copyright constraints when incorporating third-party assets, set real privacy settings for collaborative work, and make consequential decisions about content sharing. These encounters build more transferable safety knowledge than conventional digital citizenship teaching.
Workflow-embedded prompts can instil safety practices by removing the cognitive cost of compliance decisions: copyright checking and privacy settings become routine rather than burdensome. Such scaffolding must be calibrated, however. Over-automating safety decisions can prevent students from developing the independent thinking expected of good digital citizens. Proponents of explicit instruction go further and argue that embedded cues are too implicit to guarantee coverage; students may miss key principles when no prompt happens to appear (Ribble, 2015). They propose dedicated digital citizenship modules that address risks such as cyberbullying, data exploitation, and misinformation before students encounter them in projects.
Impact on Problem Solving
A meta-analysis of K-12 programming education found that creation-oriented programming activities improve students' computational thinking (Sun et al., 2021). Problem decomposition and hypothesis testing, which are central to computational thinking (Wing, 2006; Yadav et al., 2016), are trained by the iterative nature of VR creation, where technical failure is frequent, varied, and consequential. Debugging scaffolds, such as automated error detection or guided troubleshooting workflows, can support this development gradually: strong support at the beginning, progressively withdrawn as competence grows. The shift from reactive problem-fixing to proactive error prevention marks a developmental trajectory of competence building.
Cross-Cutting Patterns and the Scaffolding-Competence Relationship
Several cross-cutting patterns qualify this evidence base. First, empirical creation studies are scarce and skewed towards secondary and higher education; Southgate et al. (2022) is a rare school-based example. Second, most interventions are short-term and measured immediately after treatment, with little longitudinal evidence on retention or transfer. Third, the empirical studies are small-scale and context-specific, which limits population validity. Fourth, none of the reviewed studies treats AI-generated pedagogical scaffolds as an independent variable; scaffolding appears as an uncontrolled background condition or a static platform feature, never as an adaptive, iteratively refined intervention. This study traces this gap within a teacher-mediated configuration; it does not isolate AIGC as an independent variable (see Section 1.1.4).
Across the five dimensions, the overall pattern is consistent: most reviewed studies report competence gains, but the magnitude varies considerably with the type and intensity of pedagogical scaffolding. Scaffolds translate technical and coordination challenges into opportunities for competence building; without them, the same complexity can overload learners and produce frustration and withdrawal. This conditional relationship between task demands, scaffolds, and competence development is the question the current evidence base has not answered, and it drives the research design in Chapter 3. The next section examines the three theoretical frameworks that supply the conceptual vocabulary for this design: cognitive load theory, scaffolding theory, and the expertise reversal effect.
2.5Technical Scaffolding and the Expertise Reversal Effect
Section 2.4 established that collaborative VR creation builds digital competence across multiple DigComp dimensions, but only when pedagogical scaffolding reframes technical challenge into productive struggle. This section analyses the theoretical principles behind that reframing. Why do technical barriers prevent learning, and what can scaffolds do to remove those barriers without removing the productive struggle? And why can scaffolds that help novices become impediments for advanced learners? These questions underpin the three-cycle design outlined in Chapter 3: Cycle 1 defines the baseline barriers, Cycle 2 tests teacher-mediated asset support as a scaffold, and Cycle 3 tests whether the scaffolded design holds for a high-achieving population.
2.5.1 Cognitive Load Theory and Scaffolding
Cognitive Load Theory (CLT) provides the vocabulary for understanding how technical barriers derail learning. CLT distinguishes three types of cognitive load (Sweller, 1988; Sweller, van Merriënboer, & Paas, 1998). Intrinsic load arises from the material's inherent complexity: the conceptual demands of planning a spatial narrative, assessing asset quality, or coordinating with peers. Germane load describes the cognitive resources devoted to schema construction and automation, the productive mental work that produces actual learning. A recent revisit of CLT argues that germane load is unnecessary and folds it into intrinsic load (Sweller et al., 2019). This study keeps the three-load vocabulary because the contrast between productive and wasted mental work maps directly onto the intervention's design goal: cut extraneous load so that working memory can go to schema construction. Extraneous load results from poorly designed instruction, confusing interfaces, or irrelevant distractions, and it consumes working memory without any learning benefit.
In collaborative VR creation, technical barriers are a significant source of extraneous load. Learners must master unfamiliar software interfaces, handle complex file formats, debug rendering issues, and synchronise multiple media types, all before they can begin the actual learning task. Makransky and Petersen (2021) document this phenomenon in immersive learning: interface complexity consistently predicts diminished learning outcomes, irrespective of the pedagogical quality of the content. The working memory spent on technical management is then unavailable for conceptual reasoning, aesthetic judgement, and collaborative negotiation.
Scaffolding theory offers a design answer. Wood et al. (1976) introduced scaffolding as temporary support that allows learners to complete tasks beyond their unassisted ability. In educational technology, scaffolding can take many forms: simplified interfaces, procedural guidance, partial solutions, and, in this study, teacher-mediated production of assets that removes the burden of production while preserving the evaluative and integrative demands (Reiser, 2004; Quintana et al., 2004). The central design criterion is that a valuable scaffold removes extraneous load without consuming germane load.
This distinction between load reduction and load redirection sets the intervention logic across the three cycles. Cycle 1 included no production scaffolding: students captured panoramas and produced all media assets manually. The resulting technical barriers dominated the student experience and consumed the cognitive capacity that should have gone to narrative design and collaboration. Cycle 2 introduced teacher-mediated asset support: teachers produced themed visual, audio, and panoramic materials with generative tools, and students curated, selected, and integrated these assets into a coherent VR narrative. This structure removed the main source of extraneous load from students while maintaining the integrative and evaluative demands that drive genuine competence development. Students still had to judge which assets fitted their narrative purposes, negotiate aesthetic criteria with peers, and resolve technical integration issues; they simply no longer had to produce the raw materials themselves.
2.5.2 The Expertise Reversal Effect and Boundary Condition Testing
Kalyuga's (2007) expertise reversal effect outlines an important boundary condition for scaffolding theory. Instructional strategies that help novices may be useless or even detrimental for more knowledgeable learners. The rationale is simple: novices lack the domain schemas needed to process complex materials efficiently, so they need scaffolding to simplify the task environment. Advanced learners already have these schemas, and the same scaffolding can interfere with their independent processing strategies or remove the productive struggle that characterises their expertise.
This phenomenon has direct implications for this study. The teacher-mediated asset support that helped Cycle 2 students overcome production constraints may work by eliminating exactly the kind of rich, productive struggle that drives engagement in high-achieving students. Students who bring well-formed problem-solving schemas, substantial baseline digital competence, and strong spatial reasoning skills may find scaffolded asset production tedious or even condescending. Such students may need more challenge rather than less, not because they cope better with production demands, but because their pre-formed schemas allow them to handle integrative tasks that would be insurmountable for less prepared students.
Cycle 3 tests this prediction directly by applying the Cycle 2 design to a purposefully selected high-achieving, science-track subsample. The study thereby asks whether the scaffolded design holds when student characteristics push it to the edge of its application range. If expertise reversal dominates, Cycle 3 should show less engagement, diminished competence development, and student reports that the task felt undemanding. If the scaffolded design continues to work, the underlying design principles can be said to hold across a reasonably broad spectrum of achievement levels. The DBR methodology does not seek proof of generalisability; it asks for principled boundary testing that shows where principles apply and where they fail (Cobb et al., 2003). Cycle 3 fulfils this role.
Boundary testing also addresses a familiar measurement issue. Ceiling effects are common when high-functioning populations are studied: students whose pre-test scores are already near the top of the instrument have little room to show improvement at post-test, even when genuine growth is taking place (Dimitrov & Rumrill, 2003). Detecting meaningful change under these conditions requires attention to effect sizes relative to the baseline, and an appreciation that small absolute gains can still be substantial given the measurement ceiling. The quantitative analysis in Chapter 6 addresses this interpretive challenge explicitly
2.5.3 Scaffold Dependency and the Rationale for Progressive Task Complexity
A final concern is the risk of scaffold dependency (Belland, 2017). If learners remain dependent on scaffolded environments, they may never develop the competence to operate independently. This is a general risk for any instructional design that keeps scaffolds in place over the long term, and it becomes especially compelling with generative AI tools, where the option to outsource work to the machine, for teachers and students alike, is built into the technology's ease of use.
This study mitigates this risk through progressive task complexity rather than scaffold fading. Scaffold theory traditionally advocates fading assistance as learner competence grows (Collins et al., 1989; van de Pol et al., 2010). In a three-cycle DBR design with different student cohorts, literal fading is not possible: each cycle involves a new cohort rather than the same students at a higher level. Instead, task complexity increases with each cycle while scaffold intensity remains constant by design. Cycle 1 students produced all assets manually, without teacher-provided materials. Cycle 2 students received teacher-produced assets for a relatively simple VR narrative task. Cycle 3 students received similar teacher-produced assets, but faced a substantially more demanding task of multimodal integration involving six media types, a hub-and-spoke spatial architecture, and genuine collaborative interdependence.
The progressive design thus tackles the dependency problem obliquely. If Cycle 3 students, who received the greatest amount of asset support, also show the strongest competence development, then scaffold dependency is not the dominant risk. The question is whether post-scaffold task demands remain sufficient to spur genuine competence development. Chapter 6 examines this question directly.
The frameworks reviewed in this section, cognitive load theory, scaffolding theory, and the expertise reversal effect, provide the design rationale for the intervention architecture in Chapter 3. They explain why technical barriers matter, why teacher-mediated asset support is a scaffold rather than a crutch, and why testing with a high-achieving subsample is necessary for establishing the boundary of the emerging design principles. The next section turns from theory to method: how researchers analyse collaborative learning in digital environments.
2.6 Analysing Collaborative Learning in Digital Environments
The collaborative creation of VR offers clear advantages and real obstacles. To understand its influence on digital competence, educational researchers must be able to quantify collaborative creation, and learning analytics offers a methodological departure from traditional observation.
2.6.1 The Evolution of CSCL Analytics
Computer-Supported Collaborative Learning (CSCL) examines how students learn together through technology (Stahl et al., 2014). Early CSCL research relied on manual methods: video recordings, surveys, and direct classroom observation (Dillenbourg, 1999). These methods provide rich qualitative understanding, but they are time-consuming, and human coders struggle to capture fast, micro-level interactions in complex digital environments (Wise & Schwarz, 2017). Contemporary CSCL environments produce continuous streams of interaction data, and researchers increasingly analyse how students interact with the system and with each other in real time (Chen et al., 2020). Assessment accordingly shifts from final outcomes to the dynamic process of collaboration. Combining learning analytics with CSCL permits analysis of collaboration at a scale and granularity beyond manual methods (Hernández-Leo et al., 2019).
2.6.2 Learning Analytics and System Logs in Immersive Environments
Learning analytics measures, collects, and analyses data about learners and their environments (Siemens & Gašević, 2012). VR environments permit fine-grained capture of learner actions: every action a student takes in a VR platform leaves a permanent digital trace. System logs record accurate timestamps for each event, such as interacting with an object, moving a 3D model, or changing a parameter (Radianti et al., 2020). Researchers can use these data to reconstruct the collaborative procedure. High frequencies of collaborative object manipulation indicate active joint problem-solving, while long periods of inactivity may signal cognitive overload or technical problems (Sweller et al., 2019). The logs also reveal how work is distributed within a team, whether one student dominates the creation process or the labour is shared. Analysing these digital traces provides an objective measurement of student engagement and collaboration quality during VR creation (Z. Wang et al., 2024), without interrupting the flow of the activity.
2.6.3 Multimodal Analytics in Virtual Reality Learning Environments
Immersive VR also allows the collection of multimodal data that goes beyond standard clickstream analytics: head and hand movement, gaze patterns, spatial positioning, voice interactions, and gesture recognition (Worsley & Blikstein, 2018). These data support real-time evaluation of collaborative dynamics (Ochoa, 2022). Spatial positioning, for example, reveals whether students gather for joint problem-solving or disperse for independent work, while gaze and gesture data can indicate shared attention and non-verbal coordination (Schneider & Pea, 2013).
2.6.4 Challenges and Future Directions in VR Learning Analytics
Learning analytics in VR settings has clear potential, but several challenges persist. The collection of extensive action-based data from students raises privacy and ethics concerns (Prinsloo & Slade, 2017), and the complexity of multimodal data demands advanced analytical approaches and substantial computational power (Worsley et al., 2021).
The deeper challenge is validity. System logs record externally observable actions, not cognitive states: the same log pattern can indicate fluent mastery, desperate guessing, reflection, confusion, or off-task behaviour (Winne & Jamieson-Noel, 2002). Multimodal fusion adds a further risk: fusion algorithms can produce artefactual patterns rather than real learning processes (Mu et al., 2020), and Suthers and Verbert (2013) caution against measurement validity drift when metrics are interpreted without a theoretical framework. Raw behavioural traces, in short, do not speak for themselves.
This study responds by treating logs not as transparent windows into cognition but as traces interpreted through theoretically grounded categories. Action sequences are coded by their functional role in the collaborative workflow, distinguishing scaffolded actions, unassisted creative contributions, and breakdown-repair sequences. Chapter 3 details this learning analytics architecture, together with the data collection protocols and ethical guidelines, including a data governance protocol that prioritises modalities mapped to the DigComp dimensions and excludes biometrically sensitive streams, such as gaze tracking, from standard collection.
2.7 Research Gaps and Chapter Summary
This chapter has reviewed the theoretical and empirical literature behind the study, and six premises follow from it. Constructionism provides the rationale for collaborative VR creation: active making develops deeper competence than passive consumption, and thoughtful scaffolding answers the direct-instruction critique (Section 2.1). DigComp 2.1 provides a validated structure for assessing that competence, and the transversal AI competence of DigComp 3.0 offers further interpretive context (Section 2.2). Maker education and collaborative learning research supply the pedagogical principles for the intervention design (Section 2.3). The VR creation evidence base shows real affordances for competence development, but remains underdeveloped and methodologically limited (Section 2.4). Cognitive load theory, scaffolding theory, and the expertise reversal effect explain when and for whom scaffolds work (Section 2.5). Learning analytics provides the instruments for capturing competence development as a process, not only an outcome (Section 2.6).
From this review, five research gaps emerge, corresponding to the gap matrix in Chapter 1 (Table 1):
Gap 1: Consumption-creation asymmetry in educational VR.Most K-12 VR research examines pre-built immersive environments in which students consume rather than create content (Radianti et al., 2020; Van der Meer et al., 2023), and active VR creation as a pedagogical design is under-evaluated. This study designs, implements, and evaluates a collaborative VR creation intervention across three iterative cycles, generating systematic evidence on how active creation develops digital competence in authentic K-12 classrooms.
Gap 2: Teacher-mediated AIGC integration in K-12 VR contexts.Research on generative AI in education focuses mainly on 2D text and image generation (Holmes et al., 2019), and empirical examinations of how AIGC operates within collaborative immersive VR environments are virtually absent (Mystakidis, 2022). This study traces how teacher-mediated asset production shifts task demands, collaboration dynamics, and competence trajectories within a shared VR authoring platform.
Gap 3: Process-level evidence of competence development.Digital competence assessment relies heavily on self-report instruments and summative testing (Calvani et al., 2010), and fine-grained, action-based evidence of how competence develops during collaborative creation is sparse (Bakharia et al., 2016). This study combines platform log data, discussion archives, and pre-post instruments to trace competence development through observable behavioural traces.
Gap 4: Evidence from diverse learner populations.Most VR education studies use homogeneous convenience samples in controlled settings (Makransky & Petersen, 2019), and evidence on how scaffolded VR creation performs across heterogeneous school contexts and achievement levels is lacking. This study tests the intervention across three cycles. The sample first expands from 41 to 130 students and then deliberately narrows to 47 high-achieving science-track students. The aim is to probe boundary conditions, not to maximise representativeness.
Gap 5: Actionable design principles for educators.Existing design guidelines for VR education emphasise presence, interaction fidelity, and individual learning outcomes (Radianti et al., 2020), and evidence-based principles for integrating scaffolded assets into collaborative VR creation, without compromising problem-solving demand, are absent. This study derives actionable design principles from cross-cycle triangulation of quantitative, qualitative, and log-data evidence.
Chapter 3 describes the research design and methods that translate these theoretical commitments into an accountable, replicable procedure.
Chapter 3:Research Design and Methods
Chapter 2 established the theoretical and empirical foundations for this investigation: Constructionism provides the pedagogical rationale for active VR creation, DigComp 2.1 supplies the five-dimensional assessment structure, and cognitive load theory with scaffolding research explains why technical barriers derail learning and how teacher-mediated asset production can redirect cognitive resources towards competence building. These commitments now require a replicable, accountable methodological procedure. This chapter describes the research design and methods of the study. Section 3.1 establishes the Design-Based Research (DBR) paradigm; Section 3.2 sets out the convergent mixed-methods design and the three-cycle structure; Section 3.3 describes the participants and institutional context; Section 3.4 details the data collection instruments; Section 3.5 explains the analytical procedures; Section 3.6 addresses ethical considerations, Section 3.7 quality control, and Section 3.8 methodological limitations; the chapter closes with a summary.
3.1 Research Paradigm: Design-Based Research
Methodological choices embed epistemological assumptions (Creswell & Plano Clark, 2018). This study adopts Design-Based Research (DBR), and the reasons are set out in Section 3.1.3.
3.1.1 Theoretical Origins of DBR
DBR originated in the learning sciences during the 1990s as a response to the shortcomings of controlled experiments and naturalistic observation (Brown, 1992; Collins, 1992), with philosophical roots in Dewey's pragmatism (1938) and Simon's design sciences (1996). This fusion emphasises theoretical progress and practical utility at the same time (Wang & Hannafin, 2005). Where positivist paradigms isolate variables to find causal regularities, DBR starts from the observation that educational phenomena are complex social systems, and that forcibly isolating variables corrupts the very phenomena researchers try to understand (Bronfenbrenner, 1979).
Three foundations underpin DBR's use in this study.
Pragmatic epistemology
DBR judges knowledge claims by their problem-solving value in application, not by their approximation of context-free truth (Creswell & Plano Clark, 2018), which matches this study's dual aim of producing scholarly knowledge and actionable guidance for K-12 teachers.
Interventionist ontology
Improving education requires researchers to design, implement, and evaluate innovations in real classrooms, not merely to observe practice (Design-Based Research Collective, 2003; Barab & Squire, 2004).
Reflexive researcher position
The researcher generates the environment under study and acts at once as designer, implementer, and analyst (Cobb et al., 2003; McKenney & Reeves, 2019). These commitments imply sustained engagement in the research setting, iterative cycles of design and refinement, and the combined use of qualitative and quantitative data (Barab & Squire, 2004).
McKenney and Reeves (2019) compare DBR to engineering research: both design artefacts that support human activity, and both must test these artefacts in use. The intervention in this study is such an artefact, and it must be evaluated in an authentic educational setting.
3.1.2 Methodological Positioning
DBR prioritises ecological validity and design responsiveness over causal inference. Randomised controlled trials (RCTs) and quasi-experiments draw causal effects through group comparison, but they lose the contextual responsiveness that iterative technological interventions require (Shadish et al., 2002). Case studies and action research produce deep contextual insight, but they lack the systematic documentation of iterative refinement that DBR demands (Yin, 2018; Kemmis & McTaggart, 2005). DBR occupies the middle ground: it produces empirically derived design principles that are situation-sensitive heuristics, not universal causal laws (McKenney & Reeves, 2019).
The limits of DBR for causal inference must be noted. Without randomised control groups, pre-test to post-test change indicates change within a group, not the caused effect of an intervention. Maturation, testing effects, historical events, and the Hawthorne effect are alternative explanations for any observed improvement (Shadish et al., 2002). The design principles in Chapter 7 should therefore be read as empirically founded heuristics for well-resourced Chinese middle schools with adequate AI infrastructure, not as universal mandates (McKenney & Reeves, 2019).
3.1.3 Rationale for DBR Selection in This Study
Three considerations justify the DBR choice, each tied to a component of the research problem.
Complexity
Collaborative VR creation involves multiple interacting elements: the technological infrastructure, teachers' preparedness, students' prior knowledge, classroom dynamics, and the socio-technical affordances of the CLEVR platform. These cannot be decoupled without deforming the learning experience (Barab & Squire, 2004). Technical barriers, a major phenomenon in this study, emerge not from any single variable but from the interplay of software limitations, hardware restrictions, and classroom ecology. DBR addresses such emergent phenomena as they occur, without forcing them into preconceived experimental categories (Design-Based Research Collective, 2003).
Evolution
The approved design covered three iterations: a baseline with traditional VR tools (Cycle 1), a teacher-mediated AIGC redesign (Cycle 2), and a third cycle whose detailed form was left open to respond to emerging findings. The implementation of Cycle 2 revealed new obstacles: students struggled to compose effective text prompts for the AI tools, a novel form of human-AI communication barrier, and competence growth was uneven across the five DigComp dimensions (Carretero et al., 2017). These findings shaped the third cycle's design, which introduced a broadened multimodal AIGC matrix and further CLEVR scaffolding. The emergence of Cycle 3 is a responsive methodological adaptation, not a deviation from the design (Design-Based Research Collective, 2003; Barab & Squire, 2004). McKenney and Reeves (2019) hold that iteration driven by emerging data defines rigorous DBR, and the way the third cycle's form emerged from Cycle 2 findings illustrates how DBR turns emerging data into documented design evolution.
Duality of outcomes
The research questions ask both for successful design elements and for the complications encountered (RQ2). This dual aim mirrors DBR's commitment to producing theoretical knowledge about how interventions function while offering practical resolutions for improving them (Anderson & Shattuck, 2012). DBR keeps design principles tied to classroom evidence while remaining usable by practitioners.
3.1.4 DBR Implementation Framework
This study follows the DBR framework of Reeves (2006), refined by McKenney and Reeves (2019): four interconnected phases of analysis, design, implementation, and reflection, which recur in a spiral across the intervention cycles (Collins et al., 2004). Table 6 summarises each phase and its application in this study. The reflection findings of each cycle feed directly into the analysis and design of the next. Limited gains on selected DigComp dimensions in Cycle 1 prompted the AIGC redesign in Cycle 2, and the prompt-engineering barriers and uneven competence growth observed in Cycle 2 drove the multimodal matrix and CLEVR changes in Cycle 3.
The four phases also map onto the research questions. Analysis and design document the rationale of each iteration (RQ2). Implementation produces the quantitative outcome data (RQ1) and the qualitative process data (RQ2). Reflection synthesises cross-cycle patterns into design principles. Because these principles derive from classroom evidence, they transfer to comparable K-12 settings.
Table 6
DBR Implementation Phases and Study Application
Phase | Core Activity | Study Application |
|---|---|---|
Analysis | Identify practical problems through literature review, needs assessment, and context analysis | Review of VR education and digital competence literature; identification of technical barriers in existing VR creation workflows |
Design | Develop solutions grounded in theoretical frameworks and prior cycle findings | Cycle 1 baseline intervention; Cycle 2 teacher-mediated AIGC redesign responsive to Cycle 1; Cycle 3 multimodal AIGC matrix and CLEVR changes responsive to Cycle 2 |
Implementation | Execute interventions with systematic mixed-methods data collection | Three-cycle deployment with pre-post DigComp assessments in all cycles, platform interaction logs in Cycle 2, focus group debriefings after Cycles 2 and 3, and classroom observations |
Reflection | Assess outcomes, analyse cross-cycle patterns, and refine design principles | Quantitative analysis of competence gains; qualitative process analysis of collaborative mechanisms; generation of evidence-based design principles |
Note.Framework follows McKenney and Reeves (2019). Three-cycle deployment reflects responsive adaptation to emerging findings, consistent with DBR's iterative refinement commitment (Design-Based Research Collective, 2003).
Reflection and iteration are the generative engine of DBR. In the reflection phase, the research team analyses quantitative competence gains to identify the DigComp dimensions that respond most strongly to specific design features. The team analyses qualitative interview data to understand the student experiences behind the numerical patterns, and examines platform logs to trace collaborative dynamics that outcome measures alone do not convey (Reimann, 2011). This integrated analysis produces the design principles, the study's main theoretical contribution. The principles stay rooted in classroom evidence, but they offer guidance that other K-12 schools can use when they introduce collaborative VR creation. The explicit documentation of how each methodological decision links to a specific research question reflects the DBR commitment to methodological rigour and practical relevance.
3.2 Research Design Overview
DBR principles are conceptual. They need operationalisation. This section transforms them into an operational concrete research design. It follows a mixed methods logic. It describes the structure of the three-cycle intervention. It defines cross-cycle comparisons. It addresses practical concerns for introduction.
3.2.1 Mixed-Method Design Logic
This study uses a convergent parallel mixed-methods design. In each cycle, quantitative and qualitative data are collected concurrently, analysed in separate streams, and brought together in interpretation (Creswell & Plano Clark, 2018). Digital competence has both measurable and experiential aspects: quantitative instruments measure the size of change, while qualitative methods address the mechanisms, such as how students work through collaborative challenges, handle technical friction, and achieve creative flow. Neither stream alone is sufficient (Johnson & Onwuegbuzie, 2004).
The convergent design offers three benefits over sequential alternatives. It aligns the data temporally: DigComp assessments, platform logs, and focus group reflections refer to the same instructional moments, which reduces retrospective bias (Fetters et al., 2013). It supports instructional responsiveness: qualitative insights from an early phase can inform scaffolding adjustments before the next one, something sequential designs cannot do (McKenney & Reeves, 2019). And it enables theoretical triangulation: convergence, complementarity, and divergence across the data streams strengthen the design principles (Fetters et al., 2013).
The quantitative strand addresses RQ1: What are the impacts of collaborative VR creation activities on students' digital competence across the five dimensions of the DigComp 2.1 framework? Pre-test and post-test administrations allow within-subjects comparisons, which control for individual differences in baseline competence (Dimitrov & Rumrill, 2003).
The qualitative strand addresses RQ2: What implementation challenges emerge across iterative cycles, which design features help students overcome these difficulties, and what actionable design principles can guide future implementations? Platform logs trace the collaborative mechanisms, and focus group interviews capture how students experience coordination challenges and creative agency (Reimann, 2009; Bakharia et al., 2016).
Table 7 links the research questions to the data strands, instruments, and analytical purposes. Quantitative results of each cycle inform the design of the next, and qualitative findings provide the explanatory substrate for the quantitative patterns (Fetters et al., 2013).
Table 7
Research Question Mapping to Data Strands and Instruments
Research Question | Data Strand | Primary Instrument | Analytical Purpose |
|---|---|---|---|
RQ1: Impacts on digital competence | Quantitative | DigComp 2.1 Pre-Post Assessment | Paired-samples t-tests; Cohen's d effect sizes; cross-cycle pattern comparison |
RQ2: Implementation challenges, effective design features, and design principles | Qualitative | CLEVR Platform Interaction Logs; Semi-Structured Focus Groups | Process analytics (Gini coefficient, temporal heatmaps); Thematic analysis; cross-cycle synthesis |
Note.The quantitative strand employs a single-group within-subjects pre-post design without a control group; qualitative strands employ purposive sampling. CLEVR = Collaborative Learning Environment in Virtual Reality.
3.2.2 Three-Cyclical Structure of the Intervention
The research unfolds in three intervention cycles, each forming a complete DBR loop of analysis, design, implementation, and reflection (McKenney & Reeves, 2019). Each cycle addresses the problems that emerged in the preceding one, and complexity increases across the sequence.
Cycle 1: Baseline Implementation.Cycle 1 followed a traditional, tool-rich VR production workflow: students used smartphones and a 360-degree camera to capture panoramic pictures around the campus and manually uploaded them to build a VR narrative. This cycle tested whether hardware control and manual file handling act as barriers that keep students from narrative design and collaboration (Kirschner et al., 2006). Technical issues, including device malfunctioning, upload confusion, and coordination shortfalls, motivated the Cycle 2 redesign.
Cycle 2: Teacher-Mediated Asset Support.Cycle 2 replaced manual capture with teacher-mediated generative tools and moved the activity from outdoor photography to indoor laboratories. Teachers used generative tools (Nano-Banana2 for posters and illustrations, Skybox AI for panoramas) to produce visual assets, and the CLEVR platform provided the collaborative workspace and captured interaction data automatically. The new workflow created its own barrier: students struggled to formulate effective prompts, a vocabulary problem of translating visual imagination into linguistic specification (Holmes et al., 2019). Competence gains were also uneven across dimensions, with strong gains in Digital Content Creation but limited movement in Safety and Problem Solving. These findings motivated Cycle 3.
Cycle 3: Multimodal Asset Integration.Cycle 3 extended CLEVR with a multimodal asset integration matrix: teachers used several AI tools to generate text, images, and audio in one workflow, and structured checklists and a hub-and-spoke workflow in which one student operated the computer while peers discussed and directed guided the collaborative tasks. This cycle tested whether students could handle greater task complexity while sustaining productive collaboration over a longer production period.
The trajectory also shifts the dominant challenge type across cycles: hardware handling in Cycle 1, prompt formulation in Cycle 2, and team coordination in a complex multi-tool workflow in Cycle 3 (Kalyuga, 2007).
3.2.3 Cross-Cycle Comparison Logic
The three-cycle structure creates a naturalistic comparison, tracking the redesign from a traditional workflow (Cycle 1) to an AI-enhanced process (Cycle 2) and then to a multimodal AIGC matrix (Cycle 3). Because all three cycles use the same outcome measure, standardised effect sizes can be compared directly. If a dimension shows small gains in Cycle 1 but larger gains after redesign, this pattern suggests that the redesign removed the initial barrier (Creswell & Plano Clark, 2018). This type of comparison supports contextually grounded theory building rather than strict causal testing (Design-Based Research Collective, 2003; Sandoval, 2014).
Cross-cycle inference nevertheless faces eight methodological threats, including cohort differences, selection bias in Cycle 3, teacher effects, temporal confounds, varying task intensity, and measurement equivalence; these are detailed in Section 3.8. The study mitigates them through triangulation within each cycle, thorough contextual documentation, and conservative interpretation that treats cross-cycle differences as indicative patterns rather than causal proof (Lincoln & Guba, 1985). The contribution of this study lies not in definitive causal claims but in empirically grounded design principles.
3.2.4 Research Design Considerations
Technological Integration.The technology stack creates a functional gradient from manual capture in Cycle 1 (smartphones and 360-degree cameras) to partial automation and then full AI-assisted creation in Cycles 2 and 3 (CLEVR with teacher-mediated generative tools). CLEVR was selected over commercial options (Mozilla Hubs, CoSpaces Edu, Engage) on four criteria: cost, scalability, ease of use, and customisability (X. Wang et al., 2022, 2023; Ertmer & Ottenbreit-Leftwich, 2010). Section 3.4.2 details the platform's technical affordances.
Contextual Adaptations.Group sizes varied by cycle: five to six members in Cycle 1, balancing collaborative benefits against coordination demands for novice users (Krajcik & Blumenfeld, 2006); six to eight in Cycle 2, testing whether reduced friction supports collaboration in larger groups; and five to six again in Cycle 3, where CLEVR's real-time editing supports coordination at that size. These adjustments reflect DBR's responsive adaptation to emerging instructional needs (McKenney & Reeves, 2019).
Implementation Support.The classroom teacher received training in CLEVR operation, the teacher-mediated generative tools, and facilitation strategies, addressing the adoption barriers identified by Ertmer and Ottenbreit-Leftwich (2010). Technical support staff provided just-in-time troubleshooting during live sessions.
Sustainability and Scaling.The design anticipates long-term feasibility (Fishman et al., 2013): schools with limited resources can start with basic panoramic capture, while well-resourced schools can adopt the full multimodal AIGC matrix. This tiered design lets schools adopt the intervention at different resource levels, and the design principles in Chapter 7 are framed as adaptable heuristics rather than fixed instructions.
3.3 Participants and Research Context
Participant selection and context definition shape the legitimacy of the findings. In DBR, sampling involves a deliberate compromise between ecological resemblance and analytical clarity (Barab & Squire, 2004; McKenney & Reeves, 2019). This section describes the purposive sampling logic of the three cycles, the participant demographics, and the institutional context.
3.3.1 Participant Selection Logic
The study uses purposive sampling, which prioritises information-rich cases with the potential for deep insight (Palinkas et al., 2015; Patton, 2015). Unlike probability sampling, purposive sampling in DBR maximises phenomenon relevance and supports contextually grounded design principles (Maxwell, 2013). The value of a sample lies not in population-level generalisation but in showing how a solution works in an authentic educational environment (Design-Based Research Collective, 2003).
Grade 7 students (aged 12 to 13) were chosen for three reasons. They have the cognitive maturity for narrative design, spatial thinking, and collaborative problem solving (Piaget, 1972). Early adolescents are open to new learning experiences and show less technology anxiety than older learners. And although they are often called "digital natives" (Prensky, 2001) with extensive technology consumption experience, they typically lack digital creation skills, which leaves measurable room for growth on the DigComp dimensions (Carretero et al., 2017).
Students had no prior experience with VR creation or with teacher-mediated generative tools of any kind. They had, however, taken part in a 360-degree panoramic campus guidance project with HKU, so they were familiar with immersive viewing and basic 360-degree photography. They had never attempted multi-user collaborative VR creation or AIGC-based asset generation. This background reduced initial orientation anxiety without giving them creation-specific skills.
The CLEVR interface is in English, so basic English proficiency was desirable. The team did not, however, test English proficiency or use it as an exclusion criterion. Real classrooms contain students with varied language backgrounds, and excluding participants on proficiency grounds would have compromised ecological validity (Bronfenbrenner, 1977). To reduce possible language barriers, the team provided bilingual interface guidance, and all focus group interviews were conducted in Cantonese, the students' native language (Marschan-Piekkari & Reis, 2004).
3.3.2 Cycle 1 Participants
Cycle 1 comprised 41 Grade 7 students. The small sample was a deliberate DBR choice: early cycles prioritise intensive observation over statistical power (McKenney & Reeves, 2019), and a small cohort allowed the team to document the frequency of technical issues before scaling up.
The classroom teacher assigned the students to eight collaborative groups of five to six members, based on classroom dynamics and knowledge of students' interpersonal relationships. Teacher-assigned groups reflect authentic classroom practice better than randomly assigned teams, which strengthens ecological validity (Schmuckler, 2001).
3.3.3 Cycle 2 Participants
Cycle 2 scaled up to 130 Grade 7 students across multiple classes, providing the statistical power to detect intervention effects with greater precision (Cohen, 1988). Cycle 2 also served as a scaling test: whether the teacher-mediated redesign, incorporating Skybox AI, would remain effective beyond controlled pilot conditions. Groups of six to eight members were used, reflecting classroom practicality, and allowed the team to observe how larger groups navigated the AI communication barrier, that is, students' difficulty in composing effective text prompts (Holmes et al., 2019).
3.3.4 Cycle 3 Participants
Cycle 3 involved a purposively selected cohort of 47 high-achieving science-track students, drawn from the same school and grade as Cycle 2 but from different classes. Students worked in groups of five to six (e.g., the Gear City group). This cohort supported in-depth focus group interviews on how students coped with coordination challenges in complex multimodal tasks; platform log data were not collected in this cycle (Section 6.3.4).
The sampling logic introduced a deliberate deviation. Cycles 1 and 2 involved intact mainstream classes, whereas Cycle 3 intentionally sampled high-achieving science-track students from the same school and grade. This deviation allowed the team to bypass basic operational training and focus on advanced multimodal collaboration. Cycle 3 findings must therefore be read as evidence of what the Multimodal Asset Integration Matrix can achieve under favourable conditions, not as probable effectiveness for mainstream Grade 7 populations. In DBR terms, the relevant standard is transferability, the degree to which results speak to theory and practice in similar circumstances, rather than statistical generalisability (Maxwell, 2013). Cycle 3's elevated baseline in motivation and prior achievement may inflate its observed effects relative to Cycles 1 and 2. The complete design decision log is provided in Appendix B.
Table 8 summarises participant demographics and group arrangements across the three cycles. The progression from 41 students in Cycle 1, to 130 in Cycle 2, to 47 in Cycle 3 reflects a deliberate DBR sampling trajectory. Cycle 1 sacrificed statistical power for observational depth, allowing the team to identify technical challenges invisible in larger cohorts. Cycle 2 tested the redesigned workflow at scale. Cycle 3 prioritised qualitative depth, tracing how high-achieving students coordinated a more complex multimodal task. Because the three groups are not equivalent, cross-cycle comparisons on RQ1 illustrate design evolution rather than isolated intervention effects.
Table 8
Participant Demographics and Group Configuration Across Intervention Cycles
Intervention Phase | Total Students | Grade Level | Group Size | Primary Objective |
|---|---|---|---|---|
Cycle 1 (Baseline) | 41 | Grade 7 | 5-6 members | Intensive observation; identifying technical barriers |
Cycle 2 (Early AIGC) | 130 | Grade 7 | 6-8 members | Scaling test; evaluating redesign and identifying communication challenges |
Cycle 3 (Multimodal Matrix) | 47 | Grade 7 | 5-6 members | Deep qualitative analysis; tracking team coordination patterns and productive collaboration |
Note.Group sizes in Cycles 2 and 3 were based on classroom availability. The initial Cycle 2 pool (139 students) came from the same school and grade as Cycle 1 but from different classes. Nine cases were removed for missing pre-/post-test data, leaving 130 valid cases. The Cycle 3 sample was purposively selected from the science and technology track, which introduces selection bias and limits direct cross-cycle comparison.
3.3.5 Institutional Context
The research took place at Dongguan Nancheng Business District Northern School, a public nine-year integrated school (Grades 1 to9) in Nancheng Street, Dongguan City, Guangdong Province. Established in September 2023, the school represents a new generation of high-tech schools in the Greater Bay Area, with an investment of about 850 million RMB and a campus of nearly 40,000 square metres. In 2025, it had 1,861 students in 41 classes and 166 faculty members. The school's educational philosophy, "Technology Empowerment, Diverse Enlightenment", aligns closely with the focus of this study: it defines artificial intelligence, technology education, and digital teaching as its key curricular characteristics, and it implements Project-Based Learning as its main pedagogical approach (Krajcik & Blumenfeld, 2006).
The school's technology infrastructure is directly relevant to this study. The facilities include 15 science laboratories, 18 science and technology function rooms, three smart classrooms, and a specialised DJI artificial intelligence laboratory, built with around 4.988 million RMB of laboratory and equipment investment and including advanced VR/AR infrastructure. The school had also collaborated with HKU on a campus VR guidance project before this study began, through which students had viewed immersive panoramas and tried basic 360-degree photography, though they had not created interactive VR content. This prior collaboration demonstrated the school's technological readiness and eased the implementation of the DBR intervention, removing the obstacles that often cause technology-enhanced learning research to fail in less prepared settings (Ertmer, 1999).
One contextual constraint deserves note. Although the school's infrastructure is excellent, it enforces a strict phone-management policy: junior-division boarding students hand in their personal phones, and the school holds them centrally and issues them only for approved activities. The phones used in this study were therefore the students' own devices, distributed to each group before the outdoor sessions and collected back afterwards, an arrangement that drew objections from some parents. This constraint shaped the intervention design and the device-management difficulties reported in Chapter 4.
The choice of Northern School reflects purposive sampling for feasibility and ecological validity (Bronfenbrenner, 1977; Palinkas et al., 2015). Its exceptional resources, however, mark a boundary condition: the findings apply mainly to well-resourced schools with similar infrastructure and institutional commitment to innovation, and may not transfer directly to under-resourced settings (Maxwell, 2013).
3.4 Data Collection Design
Three data sources form the evaluation framework: a customised digital competence self-report instrument, interaction log data from the CLEVR platform, and semi-structured focus group interviews. Each source targets a different aspect of the research questions, and their combination allows methodological triangulation (Creswell & Plano Clark, 2018; Flick, 2018).
3.4.1 Digital Competence Assessment
The principal outcome measure is a dual-scale self-report instrument based on the five dimensions of DigComp 2.1 (Carretero et al., 2017): Information and Data Literacy (IDL), Communication and Collaboration (CC), Digital Content Creation (DCC), Problem Solving (PS), and Safety (DS). DigComp is widely adopted and empirically validated in international educational research (Ferrari, 2013; Vuorikari et al., 2022), and it explicitly includes Digital Content Creation, which connects directly to the VR creation activities at the core of this intervention.
Instrument Structure.The questionnaire follows a dual-scale structure. The pre-test measures general digital competence in daily-life contexts, and the post-test measures the same dimensions with items contextualised in the VR creation activity. Each scale contains 13 items across the five dimensions: IDL (2 items), CC (4), DCC (2), PS (3), and DS (2). All items use a 5-point scale with action-oriented anchors (1 = I cannot do this; 5 = I can do this and help others). The post-test additionally includes two open-ended questions on students' most engaging or challenging experiences and their perceived competence growth. Table 9 shows the item distribution and sample items.
Table 9
Digital Competence Assessment: Item Distribution and Sample Items
DigComp Dimension | Items (n) | Pre-Test Sample Item (General Context) | Post-test Sample Item (VR Context) |
|---|---|---|---|
Information & Data Literacy | 2 | I can use search engines to find study materials. | When the teacher asked us to open a website, I could tell whether it was genuine rather than a phishing site. |
Communication & Collaboration | 4 | I use instant messaging to coordinate group tasks. | I can use the chat and notice-board features in CLEVR to coordinate with teammates in real time. |
Digital Content Creation | 2 | I can create digital presentations combining text and images. | I can combine text descriptions, images, and voiceover narration to enrich our VR story. |
Problem Solving | 3 | When my computer has problems, I try to solve them myself. | When a webpage crashed or failed to load, I tried to fix it myself instead of asking the teacher right away. |
Safety | 2 | I check privacy settings before posting content online. | When the teacher said our work might be seen by others online, I reviewed my content before agreeing to share it. |
Total | 13 |
Note.The post-test includes two additional open-ended questions on students' most engaging or challenging experiences and their perceived competence growth.
The dual-scale design serves a methodological purpose. Pre-test scores capture students' pre-existing competence in everyday contexts, and post-test scores show whether students can apply that competence in the novel VR environment. A student who scores high on general PS but low on VR-contextualised PS may understand the skill but lack the contextual confidence or technical knowledge to apply it in CLEVR. Such a pattern would suggest scaffolding gaps rather than low baseline competence, although item-context differences could also contribute. Because the two scales differ in context, the pre-post difference captures both competence change and the transfer gap between everyday and VR contexts; Section 3.5.1 describes how this is handled in the analysis, and Section 3.8 discusses the corresponding limitation.
Content Validity.Eight experts, including educational psychologists, digital education scholars, and K-12 teachers with VR teaching experience, rated all 26 items (13 pre-test and 13 post-test) on relevance, clarity, and contextual appropriateness using a 5-point scale. Item-level Content Validity Ratios (CVR) were computed following Lawshe (1975); for a panel of eight experts, the minimum acceptable CVR is 0.75. The overall Content Validity Index (CVI) reached 0.85 for the general version and 0.88 for the VR version, both above the 0.80 criterion for excellent content validity (Polit & Beck, 2006). No items were deleted; three were revised based on expert feedback, including one PS item whose wording was clarified for the VR context. Experts also suggested integrating familiar Chinese digital tools, such as Douyin, into the content-creation items. Table 10 summarises the results by dimension; the full ratings appear in Appendix D.
Following Lawshe (1975), the Content Validity Ratio was computed for each item as CVR = (ne − N/2)/(N/2), where ne is the number of experts rating the item as essential (a score of 4 or 5) and N is the total number of experts. For a panel of eight experts, the minimum acceptable CVR is 0.75.
Table 10
Content Validity Results by Domain
DigComp Dimension | General Version CVR | General Version CVI | VR Version CVR | VR Version CVI | Items | Expert Feedback |
|---|---|---|---|---|---|---|
Information & Data Literacy | 0.85 | 0.88 | 0.88 | 0.90 | 2 | Strong VR contextualisation (e.g., CLEVR-specific phrasing) |
Communication & Collaboration | 0.78 | 0.82 | 0.88 | 0.90 | 4 | Strong VR contextualisation; one item revised for clarity |
Digital Content Creation | 0.75 | 0.80 | 0.90 | 0.92 | 2 | Suggestions for Douyin (TikTok) integration in content creation |
Problem Solving | 0.72 | 0.80 | 0.75 | 0.83 | 3 | One item revised for better VR fit (CVR improved from 0.65) |
Safety | 0.78 | 0.83 | 0.80 | 0.85 | 2 | Excellent cultural fit; no revisions needed |
Overall | 0.79 | 0.85 | 0.84 | 0.88 | 13 | CVI exceeds 0.80 threshold for excellent content validity |
Note. CVR = Content Validity Ratio; CVI = Content Validity Index.CVR threshold for 8 experts = 0.75. CVI > 0.80 indicates excellent content validity (Lawshe, 1975). One PS item was revised after initial expert review (CVR improved from 0.65 to 0.72).
Item Analysis.Pilot testing with 25 Grade 7 students from a comparable school examined item-level characteristics. Corrected item-total correlations ranged from 0.35 to 0.65, all above the 0.30 threshold, so no items were deleted (DeVellis, 2016). In the full Cycle 2 sample (N = 130), corrected item-total correlations likewise exceeded 0.35 for all items. Item statistics are reported in Appendix D.
Structural Validity.Exploratory factor analysis (principal axis factoring with promax rotation) on the 13 items did not yield a clean five-factor simple structure: several items loaded across factors, and the extracted factors were moderately to strongly correlated. Given the small pilot sample (N = 25), these results were treated as indicative only, and the structure was tested formally with the Cycle 2 sample.
Confirmatory Factor Analysis.The five-factor model was tested with post-test data from Cycle 2 (N = 130) using maximum-likelihood estimation in semopy 2.0 (Python; Igolkina & Meshcheryakov, 2020). Model fit was mixed: χ²(55) = 89.66, p = .002, CFI = .926, TLI = .895, RMSEA = .070, SRMR = .106. Against the conventional cut-offs of Hu and Bentler (1999), the model meets the criterion for CFI and RMSEA but misses it for TLI and SRMR. The five-factor model fitted significantly better than a one-factor model (Δχ²(10) = 54.8, p < .001), supporting the multi-dimensional interpretation. Inter-factor correlations among the admissible estimates were high (r = .28 to .94), and the IDL-CC correlation of 1.26 is an out-of-range estimate, a Heywood case, which means that the IDL and CC factors cannot be distinguished empirically in this sample (Appendix D.2.2). Dimension-level results involving IDL and CC are therefore treated as exploratory, and primary inferences rely on the 13-item composite score. Complete results, including the loading matrix, appear in Appendix D.
Convergent and Discriminant Validity.Convergent validity was assessed with Average Variance Extracted and Composite Reliability (Fornell & Larcker, 1981; Hair et al., 2019), and discriminant validity through the comparison of maximum shared variance with AVE (Fornell & Larcker, 1981; Henseler et al., 2015).Average Variance Extracted ranged from .23 to .54 and Composite Reliability from .37 to .77 across the five dimensions (Table 11). These values fall below conventional thresholds for several subscales, consistent with the high inter-factor correlations reported above. The instrument is therefore treated as a reliable composite measure with content-valid subscales, rather than as five fully distinct constructs. Dimension-level analyses in Chapters 4 to 6 are reported for design feedback and hypothesis generation, not as confirmatory tests.
Table 1 1
Convergent and Discriminant Validity Metrics by Domain
Domain | Items | AVE | CR | α (pre) | α (post) |
|---|---|---|---|---|---|
IDL | 2 | .23 | .37 | .50 | .37 |
CC | 4 | .27 | .59 | .65 | .59 |
DCC | 2 | .53 | .69 | .55 | .68 |
DS | 2 | .41 | .57 | .69 | .56 |
PS | 3 | .54 | .77 | .70 | .76 |
Overall | 13 | — | — | .854 | .849 |
Note.AVE and CR are from the five-factor CFA on Cycle 2 post-test data (N = 130). Subscale alphas are attenuated by the small number of items per subscale.
Reliability. The overall scale showed good internal consistency at both waves (α = .854 pre-test; α = .849 post-test). Subscale coefficients were lower (α = .37 to .76), as expected for subscales of two to four items (Table 11); all corrected item-total correlations exceeded .35, so all items were retained. Reliability was evaluated with Cronbach's alpha, following established reporting guidance (Nunnally & Bernstein, 1994; Taber, 2018).
Administration Procedures.The pre-test was administered before any exposure to the intervention, and the post-test immediately after the intervention concluded, with approximately four weeks between assessments. Students completed both tests in the same setting to minimise contextual variance. The instrument was administered in Chinese. The Chinese version was produced through translation and independent back-translation, with discrepancies resolved by discussion, and the expert panel reviewed the final Chinese wording (Section 3.4.1).The 5-point anchors were consistent across both scales (1 = I cannot do this; 5 = I can do this and help others). This pre-post design controls for individual differences in baseline competence (Knapp & Schafer, 2009). Self-report was chosen for practical and theoretical reasons: it efficiently captures perceived competence across multiple dimensions, including the confidence and self-efficacy aspects that performance measures may miss (Bandura, 2006), and the dual-scale structure reveals not only whether competence improves but whether it transfers to VR-specific applications. The pre-post scores address RQ1 directly, and the five-dimension breakdown identifies which domains respond most strongly to the intervention, informing the DBR redesign process (McKenney & Reeves, 2019). A week-by-week implementation timeline is provided in Appendix B.
3.4.2 Platform Interaction Logging
CLEVR Technical Overview
CLEVR, developed by the Culture Computing and Multimodal Information Research (CCMIR) laboratory at the University of Hong Kong, extends the earlier LaVR system (X. Wang et al., 2022) and was adapted for classroom deployment. Its architecture comprises three integrated components: the Story Creator, which provides the unified workspace for VR scene construction; the Learning Management module, which orchestrates task distribution and progress tracking; and the Story Player, which renders completed VR narratives. All components run in a single browser-based environment, so no specialised software installation is needed, which reduces technical problems during classroom deployment (Figure 3). The CLEVR interface was available only in English because the platform was developed in an English-medium university laboratory and no Chinese localisation existed at the time. The resulting language burden is reported as a finding (Section 5.4.2) and listed as a limitation (Section 3.8).
Disclosure. CLEVR was developed by the CCMIR laboratory, with which the research team is affiliated. Studies that document the platform's development (Ng et al., 2022; X. Wang et al., 2022, 2023; Z. Wang et al., 2024; Que et al., 2025) were conducted by members of the same laboratory. They are cited in this thesis as platform documentation, not as independent evidence, and no finding in this study rests solely on them.
CLEVR introduces four capabilities that support this study. First, real-time multi-user editing allows several students to manipulate objects, upload media, and refine scenes concurrently, turning asynchronous turn-taking into synchronous co-creation (X. Wang et al., 2023). Second, checklist scaffolding embeds predefined task sequences in the student workspace and generates structured process data. Third, contribution visualisation renders individual inputs as quantified metrics in a shared dashboard. Fourth, integrated learning analytics capture interaction events automatically. Together, these features let CLEVR serve both as an authoring tool and as a source of process data.
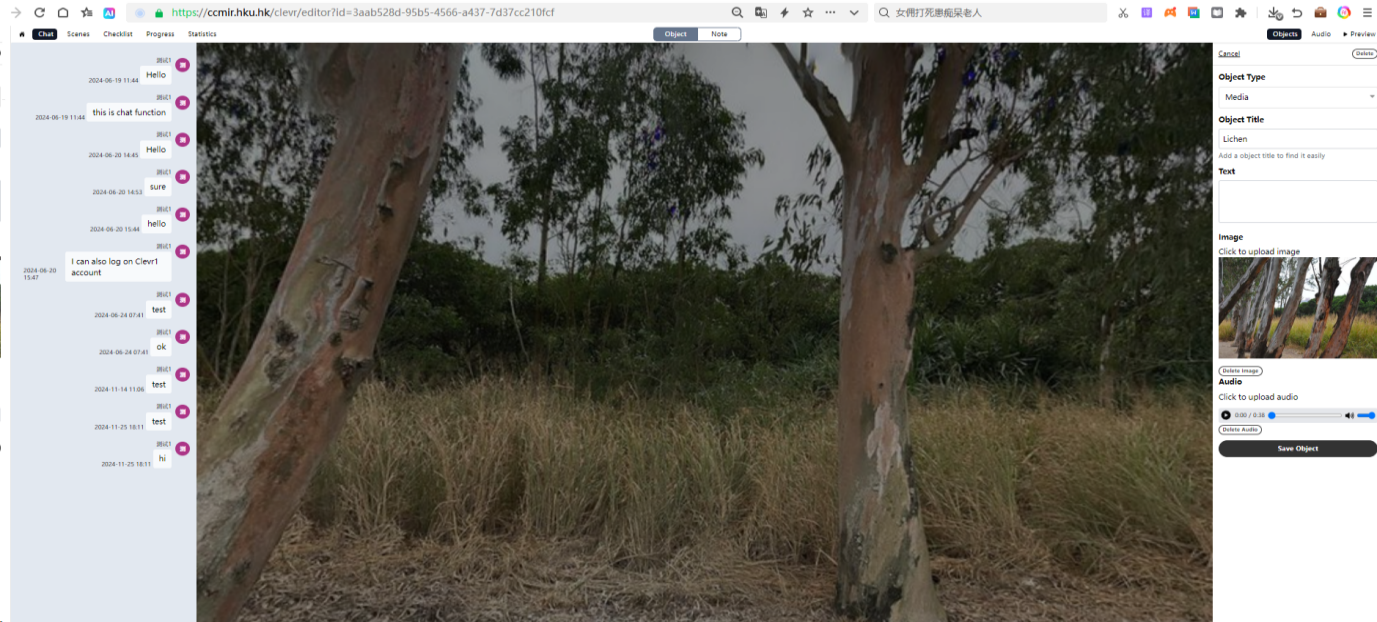
Figure 3
CLEVR Story Editor Interface.
The unified workspace integrates media management, scene construction, and interactive element placement within a single browser-based environment, supporting scaffolded development of digital content creation competences while simultaneously generating rich assessment data through embedded interaction logging.
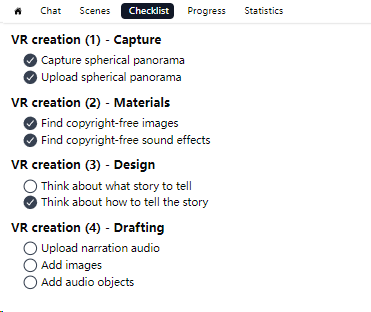
Figure 4
Checklist and Progress Dashboard Interface.
The platform's checklist functionality scaffolds structured progression through complex creative tasks, while the progress dashboard displays completion metrics, time allocation patterns, and developmental sequences that serve as quantitative indicators of procedural and collaborative digital competence.
Action Types and Collaborative Data Capture
CLEVR records all student interactions with precise timestamps, documenting collaborative processes that pure observation cannot capture (Baker & Yacef, 2009; Baker & Siemens, 2014). This logging design rests on a simple recognition: collaboration quality cannot be inferred from final products alone. Two groups may produce identical VR stories through entirely different processes, one through sustained coordination, the other through one dominant individual, and the logs differentiate these hidden patterns (Reimann, 2009; Bakharia et al., 2016).
Table 12 presents the ten action categories recorded by CLEVR, covering 49 interaction event types across the full arc of VR story creation. This taxonomy separates productive creation actions from passive navigation, which is necessary for computing Effective Output and the Gini coefficient of contribution equality (Damgaard & Weiner, 2000). Temporal heatmaps built from timestamped action sequences reveal rhythmic work patterns, for example whether high-performing groups show concentrated creation phases followed by sustained refinement (Beck & Mostow, 2008). These data provide the process evidence for RQ2.
Table 1 2
Action Types Recorded by CLEVR Platform
Category | Actions |
|---|---|
Creation/Add | Add Scene, Add Object, Add Note, Click Add Music Audio, BGM Select Song Custom Search |
Content Update | Update Scene Image, Update Scene Music Audio, Update Scene Narration Audio, Update Object |
Refinement/Update | Update Scene Music Volume, Set Scene Home |
Deletion | Delete Scene, Delete Object, Delete Scene Music Audio, Delete Scene Narration Audio |
Communication/Chat | Open Chat, Close Chat |
Navigation/System | Login, Visit Home, Visit Editor, Visit Watch, Visit QA, Visit Reflections, Switch Player Scene |
Open panels | Open Scenes, Open Objects, Open Audio, Open Entity, Open Checklist, Open Progress, Open Statistics, Open Settings, Open VR Player |
Close panels | Close Scenes, Close Objects, Close Audio, Close Entity, Close Checklist, Close Progress, Close Statistics |
Check | Checklist Check, Checklist Uncheck |
Search/Selection | Click Add Music Search, Click Add Music Cancel, Music Load More Custom Search, Music Reload Custom Search, BGM Play Song Custom Search, BGM Pause Song Custom Search, Select Object |
Note.Categories reflect the full workflow of VR story creation from project initiation through content refinement and workflow management. Action types enable computation of process analytics metrics including Effective Output, temporal activity distributions, and contribution equality indices.
Table 13 maps each DigComp 2.1 dimension to the CLEVR data sources and observable indicators, turning abstract competences into measurable, contextually embedded indicators (Calvani et al., 2008; Siddiq et al., 2016). Each dimension is evidenced through authentic digital practices rather than decontextualised test items; for example, Information and Data Literacy is evidenced through students' actual resource access and organisation within the project hierarchy.
Table 1 3
Alignment Between DigComp 2.1 Dimensions and CLEVR Data Sources
DigComp 2.1 Dimension | CLEVR Data Source | Observable Indicator |
|---|---|---|
Information & Data Literacy | Resource access logs; project organisation metrics | Search strategy introduction; systematic organisation of digital assets within scene hierarchy |
Communication & Collaboration | Communication logs; contribution visualization data; peer interaction patterns | Equitable contribution distribution; role fulfillment in collaborative tasks; quality of digital interactions |
Digital Content Creation | Creation complexity metrics; tool utilization patterns; version history analysis | Technical quality of VR scenes; creative application of media tools; iterative improvement sequences |
Safety | Permission setting logs; rights management actions; privacy protection metrics | Appropriate introduction of sharing permissions; attention to digital attribution; protection of shared project data |
Problem Solving | Tool selection patterns; error resolution metrics; problem-solving sequence analysis | Appropriateness of feature selection; technical issue resolution efficacy; adaptive response to design constraints |
Note.Each DigComp dimension operationalises through multiple CLEVR data sources, enabling triangulated assessment that combines action-based evidence with self-reported competence and qualitative interview data.
The CLEVR dashboard also provides teacher-facing metrics across four product-quality dimensions: scene upload completion, tour button configuration, background music integration, and voiceover narration quality. Each group's final artefact was scored by the two teachers present, the lead teacher and the assistant teacher, against these four dimensions. A 10% subset was rated independently by both teachers (Cohen's kappa = .85), and the remaining scores were agreed through discussion. The two teachers also implemented the intervention, so the scores reflect informed but non-blind judgement (see Section 3.8).
3.4.3 Focus Group Interviews
Qualitative data were collected through two rounds of semi-structured focus group interviews. The first round took place after the Cycle 2 intervention. Three sessions were conducted, each with five students (15 in total), organised by story theme: one group from the Gear City storyline, one from the Pearl Kingdom storyline, and one mixed group for cross-team comparison. Groups were selected for the representativeness of their theme and their members' willingness to participate, and participation was voluntary. Each session lasted about 10 minutes and served as a structured post-intervention debriefing that complements the platform log data. A second round was held one week after the end of the project with six Cycle 3 students, two each from high-, medium-, and low-achieving groups, and lasted 15 to 25 minutes per session. This round traced how high-achieving students experienced the more complex multimodal task. Focus groups suit this study because participants reconstruct shared experiences jointly: they prompt each other's memories and challenge each other's interpretations, producing richer accounts than individual interviews (Krueger & Casey, 2015; Morgan, 1997).The coding scheme, reliability checks, and example quotations are documented in Appendix C (Tables C.1-C.7).
The protocol probes three domains: collaboration dynamics (task distribution, conflict resolution, shared understanding), technology experience (CLEVR feature use, barriers encountered, strategy adaptation), and perceived competence development (which activities contributed most, and how collaboration shaped individual learning). Interviewers adapt follow-up questions to emerging themes (Morgan, 1997).
All interviews were conducted in Cantonese, the students' first language (Marschan-Piekkari & Reis, 2004). The Cycle 2 interviews were audio-recorded and transcribed verbatim and translated into English. A bilingual research assistant handled the transcription, and the lead researcher audited a 20% random sample against the recordings to verify accuracy.
The Cycle 2 interviews were conducted in Chinese, audio-recorded, and transcribed verbatim. Quotations were translated into English by the research team and checked against the recordings. The Cycle 3 debriefing was conducted in Chinese and was not recorded; the instructor took field notes.
3.4.4 Alignment of Methods with Research Questions
The data collection methods follow a deliberate triangulation strategy. Table 14 maps each research question to its primary and secondary methods and analytical contributions.
Table 1 4
Alignment of Data Collection Methods with Research Questions
Research Question | Primary Methods | Secondary Methods | Analytical Contribution |
|---|---|---|---|
RQ1: Impacts on digital competence | DigComp pre-post assessment | CLEVR process logs | Quantifies magnitude of competence change; correlates action-based patterns with self-reported gains |
RQ2: Implementation challenges, effective design features, and design principles | CLEVR process analytics (Effective Output, Gini coefficient, temporal heatmaps); Focus group interviews | Teacher evaluation scores; field observations | Identifies design features and interaction patterns associated with effective collaboration; reveals perceived barriers and adaptation strategies |
Note. Primary methods provide the principal evidence for each research question; secondary methods offer convergent or complementary validation. Triangulation across quantitative, qualitative, and process-oriented sources strengthens inferential validity for all research questions.
The alignment structure in Table 14 reflects a convergent parallel mixed-methods logic. Quantitative and qualitative data streams are collected simultaneously but analysed separately before integration during interpretation (Creswell & Plano Clark, 2018). For Research Question 1, the DigComp pre-post assessment provides the primary evidence of competence change magnitude. CLEVR logs offer convergent action-based indicators that help explain which platform interaction patterns accompany the largest self-reported gains. For RQ2, CLEVR process analytics and focus group interviews constitute complementary principle data sources. Process analytics reveal how collaborative dynamics correlate with platform usage patterns. Focus group interviews deliver the essential phenomenological depth. CLEVR interaction logs provide action-based evidence of how students enacted collaboration within the virtual environment.
The triangulation strategy actively seeks three types of cross-method relationships (Creswell & Miller, 2000; Denzin, 2017): convergence, where different methods produce similar conclusions and thereby strengthen confidence; complementarity, where one method provides unique insights the others cannot; and divergence, where conflicting results signal the need for deeper investigation (Creswell & Miller, 2000; Denzin, 2017). For instance, if DigComp assessments show substantial gains in Digital Content Creation while CLEVR logs reveal high Effective Output concentrated in a single group member, this divergence prompts closer qualitative examination of whether apparent competence gains reflect individual skill development or unequal collaboration dynamics. Similarly, if focus group participants describe effective teamwork while the Gini coefficient indicates highly unequal contribution distribution, this tension demands interpretive attention to the discrepancy between subjective experience and action-based reality. This triangulation approach treats methodological diversity as a fundamental strength, enabling more robust conclusions than any single method could produce alone (Flick, 2018). The systematic integration of quantitative competence scores, fine-grained action-based logs, rich qualitative interviews, and teacher-evaluated product quality generates evidence that is simultaneously statistically informative, contextually grounded, and theoretically generative-precisely the multimodal evidentiary foundation that DBR requires for producing trustworthy design principles (Barab & Squire, 2004; Sandoval, 2014).
3.5 Data Analysis Procedures
Data analysis transforms raw data into evidence for the research questions. The procedures mirror the convergent parallel mixed-methods design: quantitative and qualitative strands are analysed separately and then integrated.
3.5.1 Quantitative Analysis
The quantitative strand examines whether collaborative VR creation activities influence students' self-reported digital competence. Paired-samples t-tests compare pre-test and post-test DigComp scores within each intervention cycle. This within-subjects design controls for individual differences in baseline competence and therefore provides greater statistical power than a between-groups comparison of the same size (Dimitrov & Rumrill, 2003). For each cycle, the test statistic is:
where d̄ is the mean of the post-test minus pre-test difference scores, s_d is the standard deviation of the difference scores, and n is the number of paired cases in that cycle. The statistic tests the null hypothesis that the mean difference equals zero; rejection indicates a statistically significant pre-post change in self-reported digital competence.
Effect sizes complement significance testing by quantifying the practical magnitude of change. The study reports Cohen's dz for paired designs (Lakens, 2013), computed as:
that is, the mean of the difference scores divided by their standard deviation, together with 95% confidence intervals. Effect sizes are interpreted by practical magnitude rather than by statistical significance alone (Sullivan & Feinn, 2012). Cohen's (1988) conventional benchmarks (0.2 small, 0.5 medium, 0.8 large) serve as reference points, not as verdicts: a small effect can be worthwhile in an educational setting, and a statistically non-significant effect can still inform design when its magnitude is meaningful. The dz notation is used consistently in Chapters 4 to 6.
The analysis proceeds at two levels. At the dimension level, the five DigComp subscales are tested separately, which shows which domains respond most strongly to the intervention and which lag behind; these differential patterns directly inform the DBR redesign process (McKenney & Reeves, 2019). At the composite level, the overall scale score is tested as a summary indicator, which is appropriate given the high inter-factor correlations reported in Section 3.4.1. Dimension-level results are accordingly interpreted with caution, and convergent evidence from the CLEVR log data is used to corroborate them.
Because the pre-test and post-test scales refer to different contexts (everyday versus VR-specific), the pre-post difference is interpreted as a blend of competence change and context transfer, not as a pure measure of competence growth. Because the pre- and post-tests used different situational frames, strict measurement invariance between the two administrations cannot be assumed, and the scores are interpreted accordingly (Meredith, 1993).This interpretation is applied consistently in Chapters 4 to 6 and revisited as a limitation in Section 3.8.
Cross-cycle comparisons require care. Because participant groups and intervention components differ across cycles, direct statistical comparison between cycles is inappropriate. The analysis instead compares effect size patterns: a progression from small effects in Cycle 1 to larger effects in Cycle 3 would suggest that iterative refinement improved the intervention, while always admitting alternative explanations such as cohort differences (Barab & Squire, 2004; Section 3.8).
Cross-cycle comparisons of gains use two procedures. First, baseline differences between cycles are reported with independent-samples t-tests (Appendix D.6.1). Second because Cycle 3 sampled high-achieving students by design, propensity score matching compares Cycle 3 gains with those of similar Cycle 2 students. Each Cycle 3 participant was matched to a Cycle 2 student on pre-test total score and gender, using nearest-neighbour matching without replacement with a caliper of 0.2 SD of the pooled pre-test score. Balance is checked with standardised mean differences (Appendix D.6.2).
The five dimension-level tests in each cycle were specified a priori and are evaluated at alpha = .05, with exact p values and effect sizes reported so that each result can be judged by magnitude. Item-level analyses (13 per cycle) are exploratory: their p values are interpreted against a Benjamini-Hochberg false discovery rate of .05 and generate hypotheses rather than confirm them. Effect sizes are reported with 95% confidence intervals (Cumming & Finch, 2001; Smithson, 2003). Following Hoenig and Heisey (2001), post-hoc power is not reported; sensitivity is stated instead as a priori minimum detectable effects (Appendices D.3, D.4.3, and D.5.3).
The analysis followed a predetermined analysis plan developed before data collection, which guards against post-hoc analytic decisions that inflate Type I error rates (Nosek et al., 2018). Parametric assumptions were verified before inferential testing: the normality of difference scores was examined with Shapiro-Wilk tests and Q-Q plots, and extreme outliers were screened with boxplots. Where the normality assumption was violated, the Wilcoxon signed-rank test was computed as a sensitivity check, and both results are reported. Descriptive statistics and t-tests were computed in SPSS 27.0 (IBM Corp., 2020); the confirmatory factor analysis reported in Section 3.4.1 was estimated in semopy 2.0 (Python). Fit indices were interpreted against conventional cut-offs (Hu & Bentler, 1999; Kline, 2015), with incremental fit indices following Bentler (1990) and Bentler and Bonett (1980), and sample-size adequacy evaluated against power recommendations for covariance structure models (MacCallum et al., 1996).
3.5.2 Process Analytics Framework
The process analytics framework examines how students collaborated within the CLEVR platform during Cycle 2. This framework addresses Research Question 2 by identifying which platform features and interaction patterns associate with high digital competence development. The analysis draws upon three complementary analytical techniques: Effective Output quantification, the Gini Coefficient for collaboration equity, and Temporal Heatmaps for activity pattern visualisation.
Effective Output.Not all platform interactions contribute equally to the final VR product. Effective Output distinguishes productive creative actions from navigational or exploratory actions (Reimann, 2009). Productive actions are the Creation/Add, Content Update, and Refinement/Update categories of Table 12. The remaining categories are excluded from Effective Output: Navigation/System, Chat, Open/Close panels, Check, and Search actions support the process without advancing the product, and Deletion captures rework rather than progress. The remaining categories map as follows: System, Open, and Check actions count as Navigation/System; Chat counts as Communication/Chat; Delete counts as Deletion. Navigational actions (menu exploration, page transitions, and tool browsing) are excluded from the metric because they support the process without advancing task completion. This distinction operationalises the theoretical difference between productive and non-productive cognitive load (Sweller et al., 2019).Formally, Effective Output is the count of productive creation actions (Creation/Add, Content Update, and Refinement/Update), and the Production-Output Ratio is EO divided by the total number of logged events (POR = EO/Total Events). Students who generate high Effective Output relative to their total interaction count show focused, goal-directed engagement; those with low ratios may be experiencing disorientation or strategic confusion.
Gini Coefficient. Collaboration quality requires more than individual productivity. It demands equitable participation. The Gini Coefficient quantifies the equality of Effective Output distribution within collaborative groups (Damgaard & Weiner, 2000):
where x_i represents an individual member's Effective Output, x̄ denotes the group mean, and n indicates group size. The coefficient ranges from 0 (perfect equality: every member contributes equally) to 1 (maximum inequality: a single dominant contributor). This metric directly addresses the collaboration-related competence dimensions in DigComp 2.1, particularly Communication and Collaboration (Carretero et al., 2017). High Gini values signal potential team coordination challenges. They may indicate unclear role allocation, skill imbalances, or social loafing. Low Gini values suggest equitable participation. They align with sustained collaboration observed in high-performing groups.
The Gini Coefficient analysis connects to Wang et al.'s (2023) nine-dimensional collaboration quality framework. Dimension 5 (task division) and Dimension 8 (reciprocal interaction) map directly onto the equality of contribution distribution. High Gini scores indicate poor task division and limited reciprocal interaction. Low Gini scores suggest effective task allocation and balanced mutual support.
Temporal Heatmaps. Collaboration unfolds over time. Static aggregate metrics may miss dynamic patterns needed to understand how groups coordinate their work. Temporal heatmaps visualise the distribution of student activity across time periods and event categories (Beck & Mostow, 2008). The x-axis represents chronological time (e.g., 5-minute intervals within a session). The y-axis shows event categories (e.g., scene creation, content upload, peer communication, tool exploration). Colour intensity indicates activity frequency.
These heatmaps reveal coordination patterns invisible to summary statistics.Synchronous activity clusters, in which multiple students work on the same task simultaneously, suggest effective real-time collaboration.Sequential handoffs, in which one student completes a task before another begins, indicate structured role division.Scattered, asynchronous patterns may signal coordination breakdown or individualistic work styles. The heatmaps also connect to the collaboration quality framework. Dimension 6 (time management) and Dimension 7 (technical coordination) manifest in the temporal distribution of activity. Well-coordinated groups show concentrated activity bursts aligned with task phases. Poorly coordinated groups display diffuse, unfocused activity patterns.
Table 1 5
Process Analytics Metrics for Collaboration Quality
Metric | Definition | Theoretical Connection | Analytical Application |
|---|---|---|---|
Effective Output(EO) | Count of productive actions per member (Creation/Add, Content Update, Refinement/Update) | Quantifies each member's productive contribution; input to the Gini coefficient | Measures per-member output; feeds the equity analysis |
Production-Output Ratio (POR) | EO / total logged events | Distinguishes productive vs. navigational load (Sweller et al., 2019) | Identifies which platform features drive competence gains; flags disorientation |
Gini Coefficient | Equality of Effective Output distribution within groups | Collaboration quality dimensions 5 (task division) and 8 (reciprocal interaction) (X. Wang et al., 2023) | Signals equitable vs. unequal collaboration; identifies social loafing |
Temporal Heatmaps | Activity distribution across time and event categories | Collaboration quality dimensions 6 (time management) and 7 (technical coordination) (X. Wang et al., 2023) | Reveals coordination patterns: synchronous, sequential, or scattered |
Note. All three metrics draw upon CLEVR's fine-grained interaction logging (Table 12). Metrics are calculated for each collaborative group and compared across groups to identify effective collaboration patterns.
The process analytics framework provides the action-based evidence foundation for answering Research Question 2. It identifies which specific CLEVR features and interaction patterns associate with high-competence development. It also reveals collaboration dynamics that qualitative interviews alone cannot capture. The quantitative precision of process metrics complements the phenomenological depth of focus group data.Together they generate a fuller picture of how collaborative VR creation functions as a digital competence development pathway.
3.5.3 Qualitative Analysis
Focus group transcripts were analysed thematically following Braun and Clarke's (2006) six-phase procedure (familiarisation, coding, theme generation, theme review, theme definition, and reporting). Coding combined deductive codes derived from the theoretical frameworks, including constructionist instances of active making, peer collaboration, and artefact creation, and DigComp codes for the five dimensions, with inductive codes for themes not anticipated by existing theory, such as students' creative ownership of AI-generated content and their negotiation of authorship in collaborative narratives (Tracy, 2010).
Two trained coders independently coded a random 20% of the transcripts, achieving Cohen's kappa of 0.80, which indicates substantial agreement (Landis & Koch, 1977). Discrepancies were resolved through discussion and codebook refinement before full coding proceeded.
Qualitative rigour follows Lincoln and Guba's (1985) trustworthiness criteria: credibility, through member checking and peer debriefing; transferability, through thick description of context; dependability, through audit trails of analytical decisions; and confirmability, through reflexive journaling. Member checking involved sharing preliminary findings with a subset of participants to verify interpretive accuracy (Tracy, 2010).
3.5.4 Integration Strategy
The convergent parallel design demands explicit integration procedures, and the study employs two: joint displays and narrative weaving (Fetters et al., 2013; Guetterman et al., 2015).
Joint displays present quantitative and qualitative results side by side for direct comparison. For RQ1, a joint display shows the pre-post effect size of each DigComp dimension alongside corresponding focus group quotations, so that convergence or divergence is visible at a glance. Narrative weaving interleaves the two strands within a single interpretive account, which suits RQ2: process metrics such as Gini coefficients and heatmap patterns are read together with interview narratives. A group with a low Gini coefficient and quotations describing satisfying collaboration shows convergence; a group with a low Gini but frustrated accounts shows that equitable participation does not guarantee a positive experience.
The strategy actively seeks divergence, not just convergence, and treats conflicting results as signals for deeper investigation rather than methodological failures (Fielding, 2012). If DigComp assessments show gains while CLEVR logs reveal minimal Effective Output, for example, the tension may indicate that students overestimated their gains, that the assessment captured self-efficacy rather than action-based change, or that the intervention built confidence without substance. These divergences generate the most valuable insights for design principle development (Creswell & Miller, 2000). The integrated analysis thereby serves DBR's dual objectives: scholarly insight into how collaborative VR creation influences digital competence, and evidence-based design principles for educators (McKenney & Reeves, 2019).
3.6 Ethical Considerations
This study was approved by the Human Research Ethics Committee at the University of Hong Kong (Reference: EAE25015). The approval covered all three intervention cycles and the associated data collection procedures, including VR use by minors, platform logging, and focus group recording. Approval was granted contingent on the safeguards described below.
Informed Consent and Assent
This subsection first describes the consent procedure specified in the approved protocol, and then discloses how execution deviated from it. The approved procedure was two-tier: parents or guardians would provide written informed consent, and students would provide oral assent before each data collection session. In execution, students received an oral explanation of the study's purpose, procedures, and their right to withdraw before each data collection session, and they recorded their assent on group signature sheets. The parental written consent forms were not distributed in any of the three cycles. This deviation was identified during the preparation of this thesis. A deviation report and a remediation plan have been submitted to the Faculty Research Ethics Committee: every participating family will receive a full parental information letter with a two-week opt-out window during which they may request deletion of their child's data, and students will receive an age-appropriate assent information sheet. No parent or student raised concerns about the research procedures during the study itself.
Privacy and Data Protection
Personal data are processed in accordance with the Personal Data (Privacy) Ordinance of Hong Kong. Because the research site is in mainland China, the study was designed to comply with the Personal Information Protection Law of the People's Republic of China (PIPL); execution deviated as disclosed above. The partner school granted institutional permission for the study. Under the approved protocol, the personal information of students under the age of 14 was to be processed with the written consent of their guardians, and the parental consent form stated that de-identified data would be transferred to and stored on secure servers at the University of Hong Kong. Because the forms were not distributed in execution, the remediation described above seeks retrospective parental consent on the same terms. Personal identifiers were replaced with anonymous codes immediately after collection, before any transfer. CLEVR platform logs are configured to collect only research-relevant data: the platform's default logging was modified to exclude student names, profile information, and device identifiers (X. Wang et al., 2022). Audio recordings from focus groups are stored separately from transcripts, and transcripts use pseudonyms.
Data retention follows the University's standard policy. Raw data are retained for five years post-publication to support verification and replication, after which all identifiable data are destroyed. Anonymous aggregated datasets may be retained indefinitely for secondary analysis.
Special Considerations for VR Research with Minors
VR research with children demands additional safeguards, and the study introduces four. First, session duration is limited to 20 to30 minutes per VR exposure to minimise cybersickness risk, whose symptoms include dizziness, nausea, and disorientation (Stanney et al., 1998); breaks are mandated between sessions, students are encouraged to report discomfort immediately, and alternative non-VR activities are available. Second, physical safety protocols require clear play areas, adult supervision throughout, seated headset use, and equipment inspection before each session. Third, content appropriateness is reviewed before deployment: all VR environments, teacher-mediated imagery, and student-created content are screened for age-inappropriate material, and the platform's content moderation features flag student uploads for review. Fourth, accessibility accommodations ensure equitable participation, including adjusted display settings, simplified controller configurations, and alternative input methods, so that no student is excluded on the basis of disability.
Parental concerns about phone use. In Cycle 1, the school issued students' own phones for the outdoor sessions and collected them back afterwards, an arrangement that drew objections from some parents. Concerns were addressed through the school's existing phone-management procedures, phones were used only in teacher-supervised sessions, and parents could withdraw their child at any time without penalty. From Cycle 2 onwards, all activities moved to the school computer laboratory and personal phones were no longer used.
3.7 Quality Control Measures
Quality control operates at the levels of analytical rigour and data integrity. Instrument validation is reported in Section 3.4.1, and inter-rater reliability for qualitative coding in Section 3.5.3.
On the technical side, the research team systematically cross-checked CLEVR platform log data against dashboard summaries to verify that automated metrics accurately reflected student activity, and synchronisation errors were corrected before the data entered the process analytics pipeline.
Multiple safeguards protect data integrity. All recordings are backed up to encrypted cloud storage within 24 hours of collection, and local copies are deleted after verified upload. DigComp questionnaires are checked for completeness before students leave the session, and incomplete questionnaires are flagged for follow-up. Double data entry ensures accuracy for manually entered scores, and discrepancies are resolved against the original questionnaire.
3.8 Limitations and Mitigations
No methodology is without limitations. Eight limitations constrain the findings, each paired with a mitigation strategy.
Non-equivalent groups across cycles
The three cycles involved different participant groups: 41 students in Cycle 1, 130 in Cycle 2, and 47 high-achieving science-track students in Cycle 3. These groups differ in size, composition, and presumably baseline characteristics, so cross-cycle comparisons describe patterns rather than establish causal effects. Other explanations, including different student populations, maturation, or historical events, could account for the observed patterns (Maxwell & Delaney, 2004). Mitigation: thick description of each cycle's context, enabling readers to assess transferability (Lincoln & Guba, 1985).
Selection bias in Cycle 3
The purposive sampling of 47 high-achieving science-track students introduces selection bias, as these students likely possess higher prior digital competence and motivation than the broader Grade 7 population. Cycle 3 findings show the potential of the Multimodal Asset Integration Matrix under favourable conditions, not its probable effectiveness with mainstream populations (Maxwell, 2013). Mitigation: comparing Cycle 3 patterns against the larger, more diverse Cycle 2 population.
Self-report and response shift bias
The competence measure relies on self-report, and students may misestimate their abilities. Response shift bias poses a particular threat (Dimitrov & Rumrill, 2003): as students gain experience, their internal standards for competence may shift, so a student who first rated herself "advanced" might later rate herself "intermediate" despite objective improvement. Mitigation: triangulation with action-based CLEVR log data; divergence between self-report and log data triggers careful interpretive attention (Podsakoff et al., 2003).
Measurement context difference
The pre-test measures competence in everyday contexts and the post-test in VR-specific contexts, so the pre-post difference blends competence change with context transfer (Section 3.5.1). Mitigation: the blended interpretation is applied consistently across Chapters 4 to 6, and log data provide a behaviourally anchored complement to the self-report scores.
Teacher effects
The same teacher implemented all three cycles, which ensures pedagogical continuity but introduces confounds: the teacher's growing familiarity with VR tools may itself improve instruction over time. Mitigation: the teacher's professional development was documented through training logs and reflection journals. Keeping the teacher constant isolates intervention effects from teacher variability, but teacher-specific characteristics may limit transfer to other educators.
Temporal and history effects
The three cycles ran consecutively within one semester, from late September 2025 to late January 2026, with several weeks of analysis and redesign between cycles. This compressed single-semester timeline limits maturation and history effects by design, although external events within the semester, such as the rapid evolution of generative AI tools and seasonal variations in student energy, could still influence outcomes. Mitigation: contextual events were documented in a research journal for post-hoc assessment.
Intervention intensity heterogeneity
The cycles differ in tools, setting, duration, and intensity, so effects cannot be attributed to any single component. Mitigation: all intervention components are documented transparently, and DBR's goal is understood as producing design principles for the intervention package, not isolating component effects (Barab & Squire, 2004).
Prior-experience contamination. Students had taken part in a 360-degree panoramic campus project with HKU before this study. They had viewed immersive content and taken basic 360-degree photographs, but had not created VR content. This prior exposure may have eased initial orientation and could have inflated Cycle 1 baseline scores on technology-related items.
Qualitative depth. The focus group debriefings were short (about 10 minutes in Cycle 2; 15 to 25 minutes in Cycle 3), which limits the depth of individual accounts. The qualitative evidence is therefore used to illustrate and triangulate patterns in the log and survey data, not as a standalone basis for claims about mechanism. The Cycle 3 debriefing was not audio-recorded or transcribed. Quotations in this thesis come from the Cycle 2 focus groups (T1-T3); Cycle 3 qualitative evidence consists of instructor field notes and observations.
Non-blind artefact scoring. The two teachers who scored the group artefacts also implemented the intervention, so the dashboard scores reflect informed but non-blind judgement. A 10% independently double-rated subset gave Cohen's kappa of .85.
Interface language. The CLEVR interface was English-only, which added extraneous load unrelated to the learning goals (Section 5.4.2). Chinese localisation is a priority for platform development.
Context specificity and external validity
The study was carried out in a single, exceptionally well-resourced school in Dongguan, China. Findings may not transfer to under-resourced schools, other cultural contexts, or other grade levels. Mitigation: thick description of the research context enables readers to assess transferability, and the study offers contextually grounded design principles rather than universal generalisations (Lincoln & Guba, 1985).
3.9 Chapter Summary
This chapter has presented the methodological framework of the study, shaped by three key decisions. First, DBR provides the paradigm: it retains ecological validity and iterative flexibility while producing both theoretical insight and design guidance (Section 3.1.2). Second, a convergent parallel mixed-methods design integrates quantitative pre-post DigComp assessment (RQ1) with CLEVR process analytics and focus group interviews (RQ2). Third, three intervention cycles refine the design progressively: Cycle 1 established the baseline and exposed technical barriers, Cycle 2 introduced teacher-mediated asset support and encountered AI communication barriers, and Cycle 3 tested a multimodal AIGC matrix with a high-achieving cohort. Practical considerations, including technological integration, implementation support, ethical safeguards, quality control, and the limitations above, were also addressed.
Chapters 4 to 6 present the empirical findings of each cycle, and Chapter 7 synthesises the cross-cycle patterns into evidence-based design principles for educators.
Chapter 4: Cycle 1 Findings: The Baseline and Technical Barriers
Chapter 3 outlined the methodological architecture of this Design-Based Research: a convergent mixed-methods design spanning three intervention cycles, each comprising pre-post competence assessment, with platform interaction logging in Cycle 2 and focus group debriefings after Cycles 2 and 3. This chapter presents the first empirical cycle: a baseline intervention in which 41 Grade 7 students engaged in manual 360-degree panoramic capture with traditional VR tools. Cycle 1 serves two purposes. It establishes the empirical baseline against which later redesigns are evaluated, and it identifies the technical barriers that motivated the teacher-mediated asset support introduced in Cycle 2. The chapter proceeds from intervention design (Section 4.1) through participants and context (Section 4.2), implementation (Section 4.3), quantitative findings (Section 4.4), and in-depth failure case analysis (Section 4.5), to the implications for the Cycle 2 redesign (Section 4.6).
4.1 Overview of Cycle 1 Intervention
Cycle 1 was designed as a baseline implementation that positioned students as active creators of immersive media rather than passive consumers, in line with the constructionist view that learners build knowledge most effectively when designing meaningful artefacts (Papert, 1980). The intervention included four 45-minute sessions over two weeks: Session 1 introduced the task and tools, Session 2 involved outdoor panoramic capture, Session 3 focused on platform-based assembly and editing, and Session 4 covered finalisation and presentation.
Cycle 1 relied on two primary tools: Around Capture, a panoramic camera app developed by the HKU CCMIR laboratory, and 720yun, a commercial VR platform for scene assembly and publication. Students used smartphones with Around Capture to take 360-degree images on campus and uploaded them to 720yun for editing and publication. CLEVR, the research team's own VR creation platform (Section 3.4.2), was not yet ready for classroom deployment, so Cycle 1 used 720yun, a publicly available platform with similar functionality but without backend data access. No generative AI tools were used in Cycle 1; students relied entirely on manual capture and platform-based editing.
The task required each group to design and produce a VR story about a specific corner of the school campus. This constraint provided narrative coherence while allowing creative freedom, and different locations were assigned to different groups to ensure variety and prevent direct copying.
Three theoretical perspectives shaped the design and its expectations. Constructionism predicts that learning is most effective when students create shareable artefacts for real audiences (Papert, 1980; Kafai & Resnick, 1996), which the VR story task applied directly. Cognitive Load Theory predicts that the high extraneous load of manual panoramic capture would interfere with higher-order learning goals (Sweller, 1988). Flow theory predicts that when technical challenges exceed students' skills, frustration and disengagement follow rather than sustained engagement (Csikszentmihalyi, 1990). The findings below were consistent with the latter two predictions, although no direct measure of flow was taken.
4.2 Participants and Research Context
Cycle 1 involved 41 Grade 7 students (aged 12 to13) from the partner school described in Section 3.3.5. The modest sample size was a deliberate DBR choice: it allowed intensive observation and detailed documentation of challenges before scaling up, and it supported close collaboration between the research team and the classroom teacher.
The classroom teacher organised the students into eight groups of five to six members, using her knowledge of student dynamics to create functional working groups. Teacher-assigned groups reflect authentic classroom practice better than random assignment, which strengthens ecological validity (Schmuckler, 2001).
The school offered advanced technology infrastructure, including a specialised AI laboratory (Section 3.3.5). One contextual constraint nevertheless shaped this cycle directly: the school's strict phone-management policy meant that the capture workflow ran on students' own phones, which the school issued to each group and collected back after use (Section 3.3.5). This context supports the transferability of the findings to similar well-resourced schools with strict device policies.
Before the intervention, students had no experience with VR creation tools. Most had watched 360-degree videos on platforms such as YouTube, but none had created immersive content themselves. This reduced the risk that pre-existing VR skills, rather than the intervention, accounted for any gains. Pre-test scores (Table 16) showed the lowest baseline in Information and Data Literacy (M = 3.74), with the other four dimensions clustered around 4.0 on the 5-point scale (CC 4.16, DCC 4.01, DS 4.01, PS 4.10). This pattern is consistent with previous findings that K-12 students are typically more comfortable consuming information than creating content (Ferrari, 2013).
4.3 Intervention Design and Implementation
The intervention followed a four-session sequence that took students through the complete VR creation workflow. In Session 1, the teacher presented example VR scenes, demonstrated Around Capture and 720yun, and students practised in a low-stakes setting; groups were also assigned their campus locations and planned what to capture. In Session 2, groups moved to their outdoor locations and had about 30 minutes to capture scenes with one or two shared smartphones; intense sunlight caused severe screen glare, the app's rotation requirement challenged students' motor skills, shaky hands produced fractured panoramas with "ghosting" effects, and two phones overheated and crashed, so that usable scenes per group ranged from 3 or 4 to 10 to 15. In Session 3, students assembled their scenes in 720yun in the computer laboratory; account registration stalled several groups for nearly 15 minutes because students had no personal phones for SMS verification, some groups uploaded standard 2D photos that the platform rendered as distorted images or black screens, and flaws in the outdoor captures could not be repaired in the platform. In Session 4, groups finalised and presented their scenes, but unresolved technical issues left many products incomplete, and presentations were abbreviated. This design-implementation gap is analysed in Sections 4.4 and 4.5.
4.4 Quantitative Findings: Digital Competence Development
Paired-samples t-tests compared pre-test and post-test scores (N = 41) across the five DigComp dimensions: Information and Data Literacy (IDL), Communication and Collaboration (CC), Digital Content Creation (DCC), Safety (DS), and Problem Solving (PS). Table 16 summarises the descriptive and inferential statistics. Students showed statistically significant gains in three dimensions (IDL, CC, and DCC), no significant change in DS, and a small, non-significant gain in PS.
Table 16
Descriptive Statistics and Paired-Samples t-test Results for Digital Competence Dimensions in Cycle 1
Dimension | Pre M | Pre SD | Post M | Post SD | t | p | d |
|---|---|---|---|---|---|---|---|
Information & Data Literacy | 3.74 | 0.81 | 4.34 | 0.75 | 5.54 | <.001 | 0.86 [0.55, 1.17] |
Communication & Collaboration | 4.16 | 0.75 | 4.37 | 0.74 | 2.13 | .039 | 0.33 [0.02, 0.64] |
Digital Content Creation | 4.01 | 0.81 | 4.67 | 0.69 | 3.01 | .005 | 0.47 [0.15, 0.79] |
Digital Safety | 4.01 | 0.90 | 4.22 | 0.62 | 0.59 | .562 | 0.09 [-0.22, 0.40] |
Problem Solving | 4.10 | 0.90 | 4.37 | 0.50 | 1.69 | .099 | 0.26 [-0.05, 0.57] |
Note.N = 41; df = 40; p values are two-tailed. dz = Cohen's d for paired designs (Lakens, 2013). Significance is evaluated at the per-comparison alpha of .05 (Section 3.5.1).
4.4.1 Information and Data Literacy
The largest improvement occurred in Information and Data Literacy, rising from the lowest baseline of the five dimensions (M = 3.74, SD = 0.81) to M = 4.34 (SD = 0.75), a large effect (dz = 0.86, 95% CI [0.55, 1.17]). Because Information and Data Literacy started from the lowest baseline, part of this gain may reflect regression to the mean (see Section 5.5.1). The intervention's workflow directly exercised this competence. During outdoor capture, students had to decide what to photograph, judge whether a scene was worth including, and organise their visual materials for later assembly; during platform editing, they repeatedly evaluated whether their images were usable, which required them to apply quality criteria to their own information sources. Because IDL started from the lowest baseline, it also had the most room to grow. This result suggests that even a technically troubled creation task can exercise foundational information skills, provided the task requires students to make selection decisions about real content. Dimension-level results are exploratory (Section 3.4.1).
4.4.2 Communication and Collaboration
Communication and Collaboration showed a modest but significant improvement, from M = 4.16 (SD = 0.75) to M = 4.37 (SD = 0.74), a small-to-medium effect (dz = 0.33, 95% CI [0.02, 0.64]). The task was highly collaborative by design: groups had to coordinate who captured which scene, make joint decisions about locations, and share a limited pool of phones issued by the school. The relatively small effect size, however, suggests that the task design did not fully exploit the potential for collaborative learning. Qualitative observations in Section 4.6.2 indicate that much of the observed collaboration consisted of surface coordination, such as device sharing and turn-taking, rather than the deeper co-creation the intervention aimed to support.
4.4.3 Digital Content Creation
Digital Content Creation showed a moderate improvement, from M = 4.01 (SD = 0.81) to M = 4.67 (SD = 0.69) (dz = 0.47, 95% CI [0.15, 0.79]). Students engaged in authentic digital production: they composed panoramic scenes, arranged them into a narrative sequence, and configured navigation hotspots in 720yun. The gain is notable given how much of the available material was compromised, with fractured panoramas, distorted formats, and black screens documented in Section 4.5.2. The effect size likely underestimates what the task could achieve under better technical conditions, an interpretation that directly motivated the Cycle 2 redesign.
4.4.4 Safety
Safety showed no statistically significant change, from M = 4.01 (SD = 0.90) to M = 4.22 (SD = 0.62) (t(40) = 0.59, p = .562, dz = 0.09, 95% CI [−0.22, 0.40]). This null result is consistent with the design of Cycle 1. The task contained no explicit safety component: students photographed campus scenes, shared little of their work beyond the classroom, and faced few authentic decisions about copyright, privacy, or responsible sharing. The high baseline (M = 4.01) may also have left limited room for movement on a five-point scale. This finding informed the Cycle 2 and Cycle 3 designs, where safety-relevant decisions were deliberately built into the workflow, for example through copyright checks on AI-generated assets and permission settings on shared workspaces.
4.4.5 The Problem Solving Dimension
Problem Solving showed a small, non-significant gain (t(40) = 1.69, p = .099, dz = 0.26, 95% CI [−0.05, 0.57]). This result fell short of expectations because the task was designed to require problem-solving in authentic contexts: students needed to troubleshoot technical issues, select tools, and adapt their plans when things failed.
The result cannot be attributed to ceiling effects: the pre-test mean (M = 4.10, SD = 0.90, on a 5-point scale) was comparable to dimensions that improved significantly, and the PS subscale showed acceptable internal consistency (α = .70 to .76). The explanation lies in how students responded to technical problems. Qualitative data show that when students faced technical problems, they sought immediate help from teachers or peers and rarely attempted independent troubleshooting. The high level of technical barriers created a dependency dynamic: students relied on external support instead of developing their own problem-solving skills. This suggests that excessive technical barriers can undermine the development of higher-order competencies, a pattern examined in depth in the failure cases of Section 4.5.
4.5 In-Depth Analysis of Failure Cases
The quantitative findings provided an overview of competence development, but they masked the high variability in student experiences during Cycle 1. This section analyses the failure cases in depth, drawing on field observations, session recordings, student feedback, and teacher and administrator reflections. Two of the eight groups were selected for in-depth analysis on a maximum-contrast principle: the group with the weakest final product (Group 3) and the group with the strongest process records (Group 7).Field notes were kept in Chinese; quotations were translated by the research team, with students' original phrasing preserved as closely as possible.
4.5.1 Ecological Constraints: The Device Management Challenge
The intervention required students to use smartphones for panoramic capture, and administrators and teachers reported unexpected classroom management difficulties. Teachers observed that smartphones frequently distracted students, leading to off-task phone use (games, chat, social media). This pattern aligns with prior K-12 mobile learning research (Sung et al., 2016). These ecological constraints reduced the time available for collaborative planning and reflection: struggling groups captured fewer scenes and had less time for creative planning, a cascade of disadvantages for the later sessions.
The outdoor setting made these challenges worse. Some groups dispersed across campus, which made collaborative capture impossible; others focused entirely on social interaction, and the VR task became secondary. The ecological validity of outdoor capture came at the cost of pedagogical control.
4.5.2 Technical Barriers: The Interface Complexity Challenge
During the outdoor capture session, students reported intense frustration with the tools. The research team identified four specific sources of technical barriers. First, the barriers began before capture even started: the Around Capture app was not available in standard app stores for Android users, so students had to download and install an APK file manually through a mobile browser, an immediate barrier. Second, the app struggled with basic camera functions, and students found it hard to focus on outdoor targets. Third, the continuous capture process was fragile: a 360-degree scene required multiple sequential shots, and an incoming text message or phone call could freeze or crash the app, forcing students to discard the partial panorama and start over. Fourth, the capture process was slow, and students' shaky hands caused poor image stitching, producing misaligned buildings and "ghosting" effects on people.
From the perspective of Cognitive Load Theory (Sweller, 1988), these four demands increased extraneous cognitive load. Students spent most of their working memory managing software failures and had little capacity left for task-relevant reasoning, story design, or collaborative strategy building.
4.5.3 Case Study: Group 3's Collapse
Group 3 consisted of six students (three male, three female) with mixed academic achievement. Their experience shows how the four sources of technical barriers derailed collaborative learning. During Session 2, Group 3 faced continuous technical defeats: they spent 20 of their 30 minutes trying to complete a few basic captures, and the repeated interruptions and poor image quality destroyed their motivation. Field notes recorded their emotional complaints. One student stared at a failed panorama and exclaimed, "My arms are so tired, and look at this picture! The buildings are crooked and people have half their faces missing. It looks terrible!" Another student experienced an app crash right before finishing a scene and yelled, "I was almost finished with the whole circle, and a text message popped up! Now I have to do the entire thing again. I'm so frustrated with this app!"
These technical failures triggered negative social dynamics. Two students withdrew from the task entirely and sat on a nearby bench. The remaining four split into two sub-pairs working independently without creative coordination. By the end of the session, Group 3 had captured only four usable scenes.
The consequences carried into the next session. During platform assembly, Group 3 lacked raw material, and one student complained, "How are we supposed to make a story out of four blurry, ugly pictures?" Their final VR scene was noticeably shorter and lacked narrative logic, and group members appeared embarrassed by their product during the final presentation. Post-test scores for Group 3 members showed smaller gains than the class average (descriptive comparison, n = 6), especially in Digital Content Creation.
Group 3's experience provides direct qualitative evidence for the technical barriers pattern. The four consecutive sources (manual APK installation, poor autofocus, fragile capture sequences, and shaky image stitching) collectively consumed the cognitive resources that Collaborative Learning Theory assumes students devote to shared meaning-making (Kirschner et al., 2018). The resulting social withdrawal, with two students abandoning the task and the rest splitting into isolated pairs, shows how excessive technical barriers can escalate from individual frustration to the collapse of group collaboration. This pattern is consistent with Cognitive Load Theory's prediction that high extraneous load undermines both individual learning and social knowledge construction (Sweller et al., 2011), and it validates the central role of technical barriers in the Cycle 2 redesign rationale.
4.5.4 Case Study: Group 7's Partial Success
Group 7, five students with strong academic records and established friendships, faced the same severe technical barriers but responded differently. They quickly developed workarounds: restarting the app after each crash allowed them to capture a few more scenes, an inefficient but effective strategy that secured enough material. More importantly, they assigned specific roles: one student managed the phone, another directed the shots, and the remaining three scouted locations. This role assignment emerged organically from the technical chaos, as field notes captured: "You just hold the phone steady and restart it when it dies. I'll tell you where to point, and you guys go find the next good spot so we don't waste time."
This teamwork kept the group functioning, but at a cost. Group 7's final product was acceptable but not exceptional: their VR scene covered the location well but lacked narrative coherence. Post-test scores showed improvement in Information and Data Literacy and Communication and Collaboration, but minimal gain in Problem Solving (descriptive comparison, n = 5). Their experience shows how students adapted to high-difficulty environments through coordination strategies that helped them survive but did not necessarily promote the intended learning outcomes.
Group 7's experience both illustrates and qualifies the pattern. Their role assignment and workaround strategies, while functionally effective, represent what Hatano and Inagaki (1986) term "routine expertise" rather than "adaptive expertise": students became efficient at managing technical failure instead of engaging with the creative and problem-solving demands of VR storytelling. At the same time, their organic division of labour shows that collaborative skills can develop even when technical barriers constrain the learning environment. The minimal gain in Problem Solving, however, indicates that these adaptations did not produce the intended higher-order outcomes. Technical barriers do not inevitably cause total system collapse, as in Group 3, but they redirect student effort from cognitively demanding tasks towards procedural coping. This distinction between "survival collaboration" and "deep collaboration" became central to the Cycle 2 redesign (Section 4.6.2).
4.5.5 Cross-Case Analysis: Patterns of Failure
Comparing Group 3 and Group 7 reveals clear patterns. Technical problems were nearly universal, but their severity was uneven, which created inequitable conditions: group success depended partly on factors beyond students' control. Group 7's prior social cohesion appears to have supported its workarounds, unlike Group 3. Group 7's stronger academic records and established friendships confound this comparison, so the contrast is read as illustrative rather than as evidence about social cohesion specifically.Teacher intervention also influenced outcomes: teachers often solved problems directly instead of scaffolding independent skill development (Reiser, 2004), and this immediate help reinforced student dependency.
The remaining six groups showed intermediate versions of the same pattern: technical failures consumed varying amounts of session time, and outcomes tracked the severity of disruption rather than the ability of the members.
These cases converge on a single explanatory pattern: when technical barriers exceed a threshold, they trigger collaborative breakdown and derail learning. Section 4.6 considers the implications of this pattern for the Cycle 2 design.
4.6 Discussion and Implications for Cycle 2
Cycle 1 findings offer both encouragement and caution. Cycle 1 used a one-group pre-test-post-test design, which does not permit causal claims; the findings below are descriptive patterns within the DBR sequence.On the positive side, students developed digital competence through immersive creation, with significant improvements in three of five dimensions, consistent with prior research on the value of active creation over passive consumption (Papert & Harel, 1991; Kafai & Resnick, 1996). On the caution side, the technical barriers experienced in Cycle 1 were a fundamental obstacle that undermined higher-order learning: the Problem Solving dimension failed to improve despite the problem-rich nature of the task. For VR creation to work in regular classrooms, this barrier requires systematic redesign.
4.6.1 Technical Barriers as the Dominant Barrier
The Cycle 1 findings identify technical barriers as the dominant empirical pattern. When technical demands exceeded a threshold, they consumed the cognitive resources needed for learning and diminished outcomes for higher-order competencies. Students improved in routine skills, such as information handling and basic content creation, but they did not develop complex problem-solving capabilities.
This interpretation has direct implications for instructional design. Reducing extraneous cognitive load is a prerequisite for ambitious learning objectives, not a convenience. Educators must select and design tools that minimise barriers to entry, so that students can focus their cognitive resources on the learning task rather than on the tools themselves. This principle guided the Cycle 2 redesign.
4.6.2 Design Principles for Cycle 2
Cycle 1 findings directly informed the Cycle 2 redesign, which follows three design principles. First, reduce technical barriers through AI assistance: Cycle 2 replaced manual panoramic capture with teacher-mediated AIGC tools that generate panoramas from text prompts, removing the physical capture barriers and freeing cognitive resources for narrative design. Second, create a controlled learning environment: Cycle 2 moved from outdoor capture with school-managed smartphones to a computer laboratory with standardised equipment, enabling better classroom management and equitable access to functional technology. Third, scaffold problem-solving through graduated challenges: Cycle 2 sequenced technical challenges in manageable steps rather than introducing them all at once.
The Communication and Collaboration results also revealed a paradox worth reflection. Although CC scores improved significantly, qualitative observations suggest that the DigComp CC subscale may have measured superficial collaborative actions rather than deep co-creation: teacher field notes and session recordings indicate that the observed collaboration consisted largely of device sharing and turn-taking to cope with technical barriers, not the higher-order co-creation processes such as joint problem-solving and shared decision-making that the intervention aimed to support. Basic device sharing nevertheless has educational value: coordinating around a shared tool gave these students an initial foundation for collaboration. For later cycles, however, DigComp scores need to be supplemented with process-oriented measures of collaboration depth (Section 5.3).
4.6.3 Chapter Summary
Cycle 1 established the empirical baseline for this DBR study. Students improved significantly in Information and Data Literacy, Communication and Collaboration, and Digital Content Creation, but not in Problem Solving. The failure case analysis showed that technical barriers and ecological constraints undermined higher-order learning, and the cross-case comparison identified the threshold pattern that cascades from technical overload to collaborative breakdown. These findings generated three design principles for Cycle 2: reduce technical barriers through teacher-mediated AIGC tools, create a controlled learning environment, and scaffold problem-solving in graduated steps. Chapter 5 reports the Cycle 2 test of this redesign with 130 students.
Chapter 5:Cycle 2 Findings: Teacher-Mediated Asset Support and the Redesigned Intervention
Cycle 1 established two empirical findings. First, collaborative VR creation produced measurable competence gains even with a manual production workflow. Second, manual asset production imposed overwhelming technical barriers that consumed the cognitive resources needed for higher-order learning. These findings motivated a core design hypothesis: replacing manual asset production with teacher-mediated AIGC assets would reduce extraneous cognitive load and redirect student effort towards curatorial, collaborative, and integrative competencies. This chapter reports Cycle 2, in which 130 Grade 7 students from the same school participated in the teacher-mediated AIGC intervention. Section 5.1 presents the redesigned intervention, Section 5.2 the quantitative competence outcomes, Section 5.3 the process analytics from platform log data, Section 5.4 the qualitative insights from focus group interviews, and Sections 5.5 to 5.8 a synthesis of the three data sources and the implications for Cycle 3.
5.1 Cycle 2 Intervention Design
The Cycle 1 findings indicated two major challenges that the redesign had to address: students could not be managed effectively during outdoor smartphone capture, and the unstable capture workflow consumed the mental bandwidth needed for creative thinking. The redesign therefore had a straightforward aim: remove these barriers and free students' cognitive space for creative and collaborative work.
5.1.1 F rom Manual Capture to AI-Generated Worlds: The Core Redesign
Cycle 2 enrolled 139 Grade 7 students from the same school as Cycle 1 but from several intact classes of the same grade, working in groups of six to eight members. Nine cases were removed during data validation for missing pre- or post-test data, leaving 130 valid cases (12 7 matched pre-post pairs for the paired analyses). This one-group pre-test-post-test design does not permit causal claims: statistical significance indicates change within the group, not the isolated impact of the intervention.
The most direct change was the removal of the outdoor panoramic capture phase. In Cycle 1, students used school-managed smartphones and the unstable Around Capture app outdoors, which created the ecological and technical problems documented in Chapter 4. In Cycle 2, students no longer went outside with phones and no longer encountered the unstable camera app. Instead, the research team presented a new thematic structure based on teacher-generated AIGC content. Before the sessions, teachers and students collaborated to create two fantasy-themed worlds:Gear City (District of Gears and Gables) and Pearl Kingdom (the Abyssal Coral Kingdom). These themes replaced the Cycle 1 assignment of capturing a corner of the campus, which had carried ecological risks and limited creativity.
The research team produced an AIGC asset package for each theme (Table 17).
Table 17
AIGC Asset Package Supporting Cycle 2 Themes
Asset Type | Tool Used | Purpose |
|---|---|---|
Theme posters & narrative maps | Nano-Banana 2 | Visual world-building reference |
Illustrated picture books | Nano-Banana 2 | Narrative scaffolding for storytelling |
360° spherical panoramas | Skybox AI | VR scene backgrounds (replacing manual capture) |
Voiceover narrations | Jimeng (即梦) | Audio storytelling support |
Sound effect packages | Jimeng (即梦) | Immersive atmosphere building |
Note. AIGC = Artificial Intelligence Generated Content; VR = virtual reality. Jimeng (即梦) is a Chinese AI creative platform.
The research team then produced a comprehensive AIGC asset package for each theme (Table 17). Students received this package at the beginning of each session and curated, adapted, and assembled these assets rather than creating raw materials from scratch. This role shift was deliberate: students no longer wrestled with hardware and could focus on narrative decisions, creative choices, and team coordination. Table 18 compares the two cycles' instructional designs. The Cycle 2 intervention ran over four 45-minute sessions. Session 1 introduced the fantasy themes and the CLEVR workspace. Session 2 focused on storyboard planning with the AIGC asset package. Session 3 was the main in-class creation session (12 December). Session 4 completed assembly, testing, and presentation. The full curriculum materials, including the asset packages, templates, and operation guides, are provided in Appendix E.
Table 18
Cycle 1 vs. Cycle 2 Instructional Design Comparison
Design Dimension | Cycle 1 | Cycle 2 |
|---|---|---|
Participants | 41 Grade 7 students, 1 school | 130 Grade 7 students, same school (different classes) |
Session structure | 4 × 45-minute sessions | 4 × 45-minute sessions |
VR platform | 720yun | CLEVR |
Scene content source | Manual outdoor panoramic capture (Around Capture app) | AI-generated 360° panoramas (Skybox AI) |
Devices used | Students' own smartphones, issued and collected back by the school (outdoor use) | School computers (lab setting) |
Thematic setting | "A corner of the school campus" (real location) | Gear City / Pearl Kingdom (fantasy worlds) |
AI tools | None | Nano-Banana 2, Skybox AI, Jimeng (即梦) |
Supporting materials | None pre-provided | Full AIGC asset package (posters, maps, audio, panoramas) |
Primary ecological risk | Off-task smartphone use, device management | Controlled lab environment: minimal |
Primary technical challenge | App crashes, blurry capture, focusing failures | Learning AI prompting and asset selection |
Target competence focus | Broad digital competence baseline | Higher-order problem solving + creative collaboration |
5.1.2 Maintaining a Controlled and Collaborative Environment
Cycle 1 had demonstrated that outdoor activities with smartphones were not viable: students played mobile games and sent personal messages, which took time away from collaborative planning, and the school required a more manageable approach, and the phone-collection arrangement had also drawn objections from parents. In Cycle 2, the whole activity moved into a computer laboratory. Students used school computers for all activities and had no access to personal devices, and teachers could see every screen. The physical space itself became an asset for collaboration: group members gathered in close proximity, shared the same visual screen, and conversed about their choices as the activity unfolded. The change solved an administrative problem and also reshaped the social organisation of the activity: students now worked side by side on a shared product instead of dispersing across campus, which supported sustained face-to-face coordination.
5.1.3 Data Collection
Cycle 2 used the same four-method design as Cycle 1, which allows direct comparison across cycles.
1. Pre- and post-test questionnaire.The 13-item DigComp-based instrument (Section 3.4.1) was administered to all 130 students before and after the intervention. The post-test added two open-ended questions about the teacher-mediated generative tools and the VR creation experience, allowing students to describe their personal growth in ways a rating scale cannot capture.
2. CLEVR Platform Dashboard Data.The platform recorded all student actions during the sessions, and the Dashboard summarised each group's output. Teachers assessed project completion across four dimensions (Table 19): scene upload, tour buttons, background music, and voiceover narration.
Table 19
CLEVR Platform Dashboard: Teacher Assessment Dimensions
Dimension | What Teachers Checked |
|---|---|
Scene upload | How many 360° panoramic scenes the group uploaded. |
Tour buttons | Whether students set up the navigation buttons between scenes correctly. |
BGM | Whether students added background music to the VR story. |
Voiceover narration | Whether students uploaded an audio narration. |
Note. BGM = background music; VR = virtual reality. Teachers assessed project completion across these four dimensions to evaluate how completely students built the storytelling elements of their VR project.
Using these four dimensions, teachers assigned each group a completion score. It represented the fullness of how students constructed the storytelling aspect of their VR project.
Teacher assessment rubric.The four-dimension dashboard score (0 to100) was developed jointly by the research team and the participating STEM teachers before Cycle 2. Each dimension was rated complete (1) or incomplete (0), giving a maximum of 4 points converted to a percentage. Each group's final artefact was scored jointly by the two teachers present (the lead teacher and the assistant teacher), and a 10% subset was rated separately by both,giving Cohen's kappa of .85. The rubric targets product completeness rather than creativity, which matches Cycle 2's goal of securing basic technical competence before higher-order design challenges. Its limitation is that aesthetic quality, narrative coherence, and collaborative process are not covered; these are addressed by the log data and focus group analyses.
3. CLEVR platform log data.Beyond the Dashboard summaries, the CLEVR system logged each individual action with a timestamp and user ID. This "Movements" dataset contains the full sequence of student actions, including when students uploaded a scene, added an object, adjusted audio, or viewed the progress checklist, and it reveals the real process behind the final product.
4. Focus group interviews. The research team conducted focus group interviews with selected students after the intervention (Section 3.4.3). All sessions were audio-recorded and transcribed, and the transcripts were analysed for themes concerning the AIGC workflow, the shift from technical barriers to collective engagement, and the new obstacles that arose in Cycle 2.
5.2 Quantitative Findings: Impact on Digital Competence (RQ1)
Paired-samples t-tests compared pre-test and post-test scores across the five DigComp dimensions for the 12 7 matched pre-post pairs. Following the analysis plan (Section 3.5.1), exact p values are reported at the per-comparison alpha of .05 with Cohen's dz and 95% confidence intervals, and Wilcoxon signed-rank tests were computed as sensitivity checks. Table 20 reports the full results.
Table 2 0
Descriptive Statistics and Paired-Samples t-test Results for Cycle 2 (N = 12 7)
Dimension | Pre M (SD) | Post M (SD) | t(126) | p | dz [95% CI] |
|---|---|---|---|---|---|
IDL | 3.67 (0.83) | 4.04 (0.78) | 5.58 | <.001 | 0.49 [0.32, 0.67] |
CC | 4.01 (0.73) | 4.09 (0.65) | 1.62 | .107 | 0.14 [−0.03, 0.32] |
DCC | 3.91 (0.89) | 4.12 (0.85) | 2.71 | .008 | 0.24 [0.07, 0.42] |
DS | 4.49 (0.77) | 4.36 (0.79) | −2.26 | .026 | −0.20 [−0.38, −0.02] |
PS | 3.98 (0.76) | 3.99 (0.83) | 0.12 | .903 | 0.01 [−0.16, 0.19] |
Composite | 4.01 (0.59) | 4.11 (0.58) | 2.52 | .013 | 0.22 [0.05, 0.40] |
Note.N = 12 7 matched pre-post pairs from the 130 valid cases; df = 12 6; p values are two-tailed, per-comparison alpha = .05 (Section 3.5.1). dz = Cohen's d for paired designs (Lakens, 2013). Wilcoxon signed-rank tests confirmed every conclusion reported here (all ps in the same direction and significance class). 95% CIs for dz were computed as dz ± t(.975, df) × SE (SE = dz/t).
5.2.1 Significant Gains in Two Dimensions, Decline in One
The results present a more differentiated picture than an across-the-board improvement. Two dimensions improved significantly (IDL and DCC), one dimension declined significantly (DS), Communication and Collaboration showed a small, non-significant gain, and Problem Solving showed no meaningful change. The composite score improved significantly(dz = 0.22, p = .013), indicating a modest overall gain. This composite gain is sensitive to response quality: when fifteen straight-line post-test records are excluded, it becomes marginal (p = .060; Appendix D.4.3).
The largest improvement occurred in Information and Data Literacy (t(126) = 5.58, p < .001, dz = 0.49, 95% CI [0.32, 0.67]). Throughout the intervention, students reviewed, evaluated, and selected AIGC materials: they judged which AI-generated panorama best fitted their story world, checked whether an image matched the intended scene, and organised their chosen assets. These are active information literacy practices that go beyond browsing, and they mirror the mechanism behind the IDL gain in Cycle 1, where IDL was also the strongest dimension. Digital Content Creation also improved significantly (t(126) = 2.71, p = .008, dz = 0.24, 95% CI [0.07, 0.42]). Without a broken camera app in the way, students could choose, modify, and combine AI-generated assets within CLEVR, and every session required conscious decisions about content: which panorama to use, how to blend and sequence audio, and how to order the scenes.
Problem Solving showed no meaningful change (t(126) = 0.12, p = .903, dz = 0.01, 95% CI [−0.16, 0.19]). Students' own accounts explain this null result directly: when manual capture failed, groups switched wholesale to AI-generated assets ("Our photos came out crooked and full of seams, unusable, so we just used the AI-generated images; they looked better anyway," T1_4), and the generation step offered ready-made options rather than problems to solve ("The capture part could be dropped; we learned it but could not use it," T3_5). The redesigned workflow removed the very problems that could have developed problem-solving: with hardware trouble eliminated and teachers helping to repair prompts, students selected from AI-generated choices rather than formulating solutions themselves. AIGC scaffolding changed what the problem-solving task entailed, from generating solutions to selecting outputs. This distinction between competence-enhancing and competence-substituting scaffolds directly informed the Cycle 3 design (see Chapter 6).
Communication and Collaboration showed a small, non-significant gain (t(126) = 1.62, p = .107, dz = 0.14, 95% CI [−0.03, 0.32]). The controlled laboratory setting supported steady group work, but the confidence interval spans zero and the effect is small. As in Cycle 1, the observed collaboration consisted largely of coordination around a shared task rather than deep co-creation, a pattern examined further in Sections 5.3 and 5.4.
Digital Safety declined significantly (t(126) = −2.26, p = .026, dz = −0.20, 95% CI [−0.38, −0.02]), from the highest baseline of the five dimensions (M = 4.49) to M = 4.36. This is the first DigComp dimension in this study to show a decline after an intervention, and it requires careful theoretical interpretation (Section 5.5.1).
5.2.2 Cross-Cycle Comparison: Cycle 1 vs. Cycle 2
Table 21 compares the two cycles' pre-test baselines and effect sizes. The comparison is descriptive and exploratory, not causal: the cycles differ in participants (N = 41 vs. 130), platforms (720yun vs. CLEVR), physical environments (outdoor vs. indoor laboratory), task themes (campus capture vs. fantasy worlds), and AIGC availability (none vs. full teacher-mediated package), so effect size differences cannot be attributed to any single design change.
Table 2 1
Cross-Cycle Comparison of Pre-test Baselines and Effect Sizes
Dimension | C1 Pre M | C1 dz | C1 p | C2 Pre M | C2 dz | C2 p |
|---|---|---|---|---|---|---|
IDL | 3.74 | 0.86 | <.001 | 3.67 | 0.49 | <.001 |
CC | 4.16 | 0.33 | .039 | 4.01 | 0.14 | .107 |
DCC | 4.01 | 0.47 | .005 | 3.91 | 0.24 | .008 |
DS | 4.01 | 0.09 | .562 | 4.49 | −0.20 | .026 |
PS | 4.10 | 0.26 | .099 | 3.98 | 0.01 | .903 |
Note. C1 = Cycle 1; C2 = Cycle 2. dz = Cohen's d for paired designs. Cross-cycle comparisons are descriptive; differences in participants, platforms, task themes, and environments confound causal interpretation.
Three patterns stand out. First, Information and Data Literacy is the most consistent gainer across both cycles ((dz = 0.86 and 0.49)): in both workflows, the task reliably exercised students' information selection and evaluation practices. Second, Digital Content Creation continued to grow, though the effect attenuated (dz = 0.47 to 0.24), and Communication and Collaboration did not deepen: the controlled laboratory setting did not produce the collaborative gains that might have been expected, which suggests that deep collaboration needs more than a better environment. Third, Problem Solving remained flat in both cycles, and Digital Safety moved from no change in Cycle 1 to a significant decline in Cycle 2. Removing the technical barriers solved the Cycle 1 problem, but it also removed the problems that could have developed problem-solving, and it coincided with a safety-awareness cost in the AIGC workflow. These descriptive patterns, not causal claims, set the design agenda for Cycle 3.
5.3 Log Data Analysis: Unpacking the Collaborative Process
5.3.1 Defining the Process Analytics Framework
To evaluate collaborative quality, the analysis filters raw navigation noise from the log data and combines quantitative indicators with process visualisations. Two primary metrics quantify productive activity and collaborative equality. Effective Output captures the actions that directly contribute to the final product, combining three event categories: Creation/Add, Content Update, and Refinement/Update. The Production-Output Ratio (POR) divides Effective Output by the total number of events in the analysis window, showing what proportion of a team's activity is genuinely productive. The Gini coefficient measures collaboration inequality: to determine whether workload was distributed equally, the research team computed a Gini coefficient over member-level Effective Output counts, standardised by group size for cross-group comparison (Damgaard & Weiner, 2000). A larger Gini indicates that work is concentrated in fewer members. Two limitations of the Gini metric are acknowledged: its causal direction is ambiguous (a low Gini may enable high performance, or high-performing groups may simply share work more equally), and the Effective Output classification derives from the functional semantics of platform events rather than from an external competence measure. Gini values are therefore treated as proxies for collaborative process structure, not as definitive assessments of collaboration quality.
Two visual tools complement the metrics. Sequence timelines (member by time) show who did what throughout the session, and two-minute heatmaps (event category by time) reveal when activity bursts occur and how they are composed; the two-minute bin smooths second-by-second noise while preserving classroom-scale rhythms, such as bursts of editing after a teacher prompt.
The joint interpretation of Gini coefficients and heatmaps supports a mechanism-based comparison across groups. A high-performing pattern is expected to show low inequality and stable, staged activity bursts (a build-then-refine workflow); a low-performing pattern is expected to show high inequality and chaotic bursts dominated by repeated updates or deletions without clear progression; and a mid-performing pattern falls between these extremes, with sustained effort constrained by conceptual bottlenecks.
5.3.2 Analytical Window and Operationalisation of Log Events
Platform logs record student actions both inside and outside the scheduled sessions: some students revisited the platform on later days to polish their products, so the raw event counts span multiple calendar days. Analysing the entire log would inflate timelines and blur comparability across groups because different groups worked on different days at different intensities. To focus on the primary creation phase, the analysis isolates each group's most-active day.
Event counts were aggregated by calendar date for each group, and the date with the highest event volume was selected as the focal session. For all three case groups, this was 12 December 2025, the scheduled in-class creation session. The platform remained open beyond the 45-minute lesson. The logging window for that day spans about four hours, covering the lesson and continued access during breaks and after school.The three groups are therefore compared within the same instructional context and the same time budget. All heatmaps, timelines, and Gini coefficients reported in this chapter were computed within this specific window. Log activity after the study period, including a demonstration-access cluster on 25 February 2026, was excluded from analysis.
The platform records user actions as system events such as Add, Update, Search, and Navigation. These raw labels do not map cleanly onto analytical meaning. An "Update" event, in particular, can indicate two very different activities: a parameter adjustment that refines existing content, such as changing an audio volume, or a media replacement that effectively generates new content, such as re-uploading a panorama. Treating every Update event as refinement would overestimate quality-oriented work and underestimate content generation, so a functional classification was required.
Raw events were therefore categorised by their functional semantics into six mutually exclusive analytical categories (Table 22): Navigation/System, Communication/Chat, Creation/Add, Content Update, Refinement/Update, and Deletion. Each category groups specific platform action types and serves a distinct analytical function. For example, Creation/Add captures structural output initiation (scene creation and new asset uploads), Content Update captures content revision (media replacement and re-upload), and Deletion captures rework and conflict-related removal.
Table 2 2
Event Classification Scheme for Platform Log Data
Category | Platform Action Types Included | Analytical Function |
|---|---|---|
Navigation / System | Page view, login, session start/end | Captures orientation and system use. |
Communication / Chat | Chat panel use (Open Chat, Close Chat) | Captures verbal coordination. |
Creation / Add | Scene creation, asset upload (new) | Captures structural output initiation. |
Content Update | Media replacement, asset re-upload | Captures content revision. |
Refinement / Update | Text edit, layout adjustment, parameter change | Captures quality-oriented refinement. |
Deletion | Scene deletion, asset removal | Captures rework and conflict-related removal. |
Two metrics were then defined on this basis. Effective Output is the sum of the three categories that directly advance the final VR product:
Effective Output = Creation/Add + Content Update + Refinement/Update
Navigation/System, Communication/Chat, and Deletion are excluded from this measure: they support the process through orientation, coordination, and rework, but they do not themselves advance task completion. The Production-Output Ratio expresses this productive share of a team's total activity:
POR = Effective Output / Total Events
Per-group EO and POR values for the focal day are reported in Table 24.
This operationalisation turns raw logs into theory-mapped evidence. The six categories align with the collaboration quality framework of X. Wang et al. (2023), whose dimensions of task division, reciprocal interaction, time management, and technical coordination can each be traced through specific event categories, and the resulting metrics provide the process evidence for RQ2 (Section 3.5.2).
5.3.3 Case Selection and Rationale (Typical Cases)
This section examines how collaborative processes relate to product quality in the VR storytelling task. A typical-case comparative design was adopted across three performance levels, with cases selected on the basis of the teacher assessment scores and the evaluation notes in the Dashboard summary (Section 5.1.3). Group identifiers such as S01, S04, and S29 are platform registration codes retained for auditability; they do not indicate the number of groups.
High-Performing Case:Group S29. Group S29 (Class 704, 6 members) received the highest score in the class (Score = 90). The teacher described their work as "very complete" and "highly efficient". This group showed strong task progression and high-quality completion.
Mid-Performing Case:Group S04. Group S04 (Class 701, 8 members) received a good score (Score = 80). The teacher noted that this group worked conscientiously but struggled with key domain concepts: they confused panoramic images with planar images and produced redundant scenes. This case represents substantial effort constrained by conceptual and technical bottlenecks.
Low-Performing Case:Group S01. Group S01 (Class 701, 8 members) received a low score (Score = 53). The teacher reported major conceptual confusion: the group created an excessive number of scenes (over 200) without completing the actual task, and the chat logs evidenced pronounced collaboration friction, with members blaming peers for deleting items or adding excessive scenes.
These three groups form a clear outcome gradient: high, mid, and low. More importantly, the teacher comments provide mechanism-oriented anchors: efficiency, persistent conceptual bottlenecks, and task drift due to conflict. These clear distinctions make the three groups suitable for linking process indicators to final outcomes. Table 23 summarises the three cases.
Table 2 3
Overview of the Three Selected Typical Cases
Performance Level | Group ID | Members | Dashboard Score | Key Mechanism Anchor (Teacher Notes) |
|---|---|---|---|---|
High | S29 | 6 | 90 | High efficiency, strong task progression, complete product. |
Mid | S04 | 8 | 80 | Conscientious effort, but blocked by conceptual confusion (panorama vs. planar). |
Low | S01 | 8 | 53 | Severe collaboration friction, task drift, excessive redundant actions. |
5.3.4 Analytical Approach: Log Data and Process Metrics
Data Windowing: The Most-Active Day
Platform logs recorded student actions beyond the primary in-class session; for example, some students revisited the platform on later days. To improve comparability and avoid inflated timelines, an analysis window was defined for each group: event counts were aggregated by calendar date, and the date with the highest event volume was selected as the most-active day. This focal day was 12 December 2025 for all three groups. All process visualisations and indicators were computed within this specific date.
Event Classification and Effective Output
The CLEVR platform recorded user actions as system events, including Add, Update, Search, and Navigation. An "Update" log label, however, did not always mean simple refinement: sometimes an Update event meant actual content creation, such as uploading a new panorama image, and other times it meant parameter tuning. A semantic classification scheme was therefore applied, categorising raw log events into six mutually exclusive analytical categories (Table 22). Effective Output is defined as the sum of Creation/Add, Content Update, and Refinement/Update events, the three categories that contribute directly to the final VR product. Navigation/System, Communication/Chat, and Deletion were excluded from this measure because they support the process without directly advancing task completion.
Member Definition and Gini Coefficient
The Gini coefficient was used to measure inequality in productive contributions across group members, where 0 indicates perfectly equal contribution and 1 indicates that a single member produced all output.
The active member set of each group was defined first. The enrolled roster was obtained from the teachers, but not all enrolled members generated log events on the most-active day, so only members with at least one recorded event were included; these are referred to as log-observed active accounts. Group S29 required a specific clarification: the official roster lists 6 members, but the system logged 7 unique accounts on the focal day. The seventh account (s297) was identified as a spare account used by a student from another group whose own computer had lost its internet connection. His actions are not part of S29's collaboration, so they were excluded from the equality analysis, and the Gini values below use the six rostered members.
Because raw Gini coefficients are sensitive to group size, the Damgaard-Weiner correction was applied: Gini corrected = Gini raw×n/(n−1), where n is the number of log-active members. This correction ensures that observed differences reflect genuine inequality variation rather than group-size artefacts. The total Effective Output of each log-observed active account was then calculated, and the Gini coefficient was computed over this distribution. Table 24 shows the results for the three groups.
Table 24
Group Characteristics and Gini Coefficients (Effective Output)
Group | Performance Level | Total Events (Focal Day) | Log-Active Members | Gini (EO) | EO | POR |
|---|---|---|---|---|---|---|
S29 | High (score: 90) | 831 | 7 | 0.1980 | 508 | .61 |
S04 | Mid (score: 80) | 691 | 8 | 0.4054 | 222 | .32 |
S01 | Low (score: 53) | 18,652 | 8 | 0.7493 | 685 | .43 |
Note. EO and POR for S01 are reported after removal of the artefact burst (Section 5.3.5). Values were recomputed from the archived platform logs; small differences from earlier exports reflect deduplication. Gini coefficients are computed over the rostered members of each group: six in S29 and eight in S04 and S01 (Section 5.3.4).
Process Visualisations: Heatmaps and Timelines
Two visualisations were constructed to analyse the collaborative process. The temporal heatmap shows group-level activity: the x-axis represents elapsed time in minutes, the y-axis represents the six event categories, and colour intensity indicates event frequency within each two-minute interval. It answers a key question: when, and in what mode, did the group work together as a whole unit?
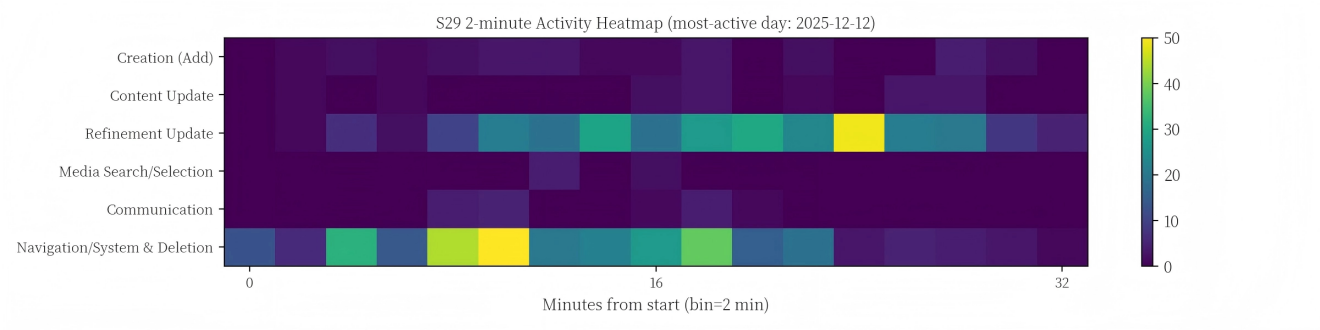
Figure 5
Temporal Heatmap of Event Frequencies for Group S29
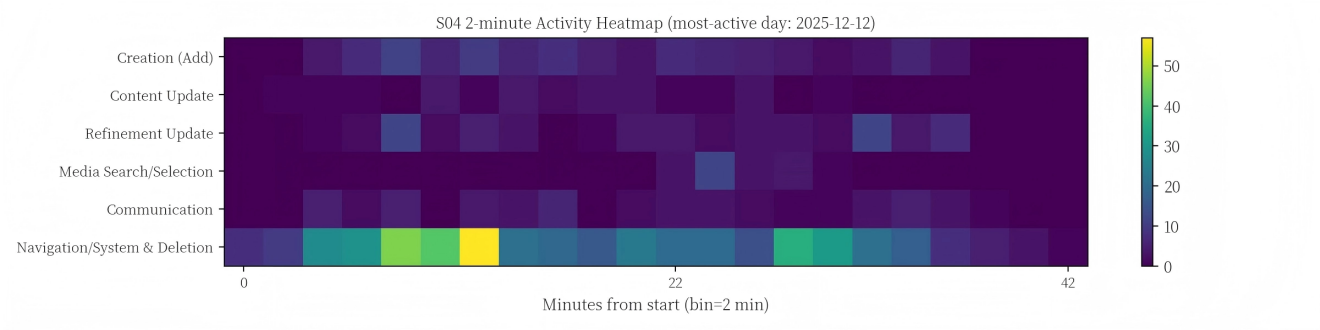
Figure 6
Temporal Heatmap of Event Frequencies for Group S04
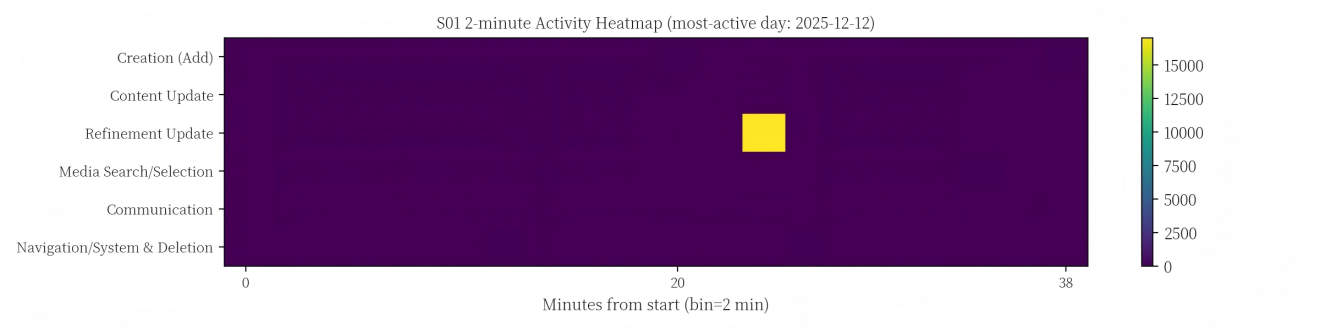
Figure 7
Temporal Heatmap of Event Frequencies for Group S01
The behavioural timeline shows member-level activity: each row represents one log-observed active member account, each data point represents a single recorded event, and colour indicates the event category: Navigation/System (blue circle), Communication/Chat (orange triangle), Creation/Add (green diamond), Refinement/Update (red square), and Deletion (purple cross). The x-axis shows elapsed time in minutes from the first recorded event. It answers a second question: which specific members were active, and when did they work?
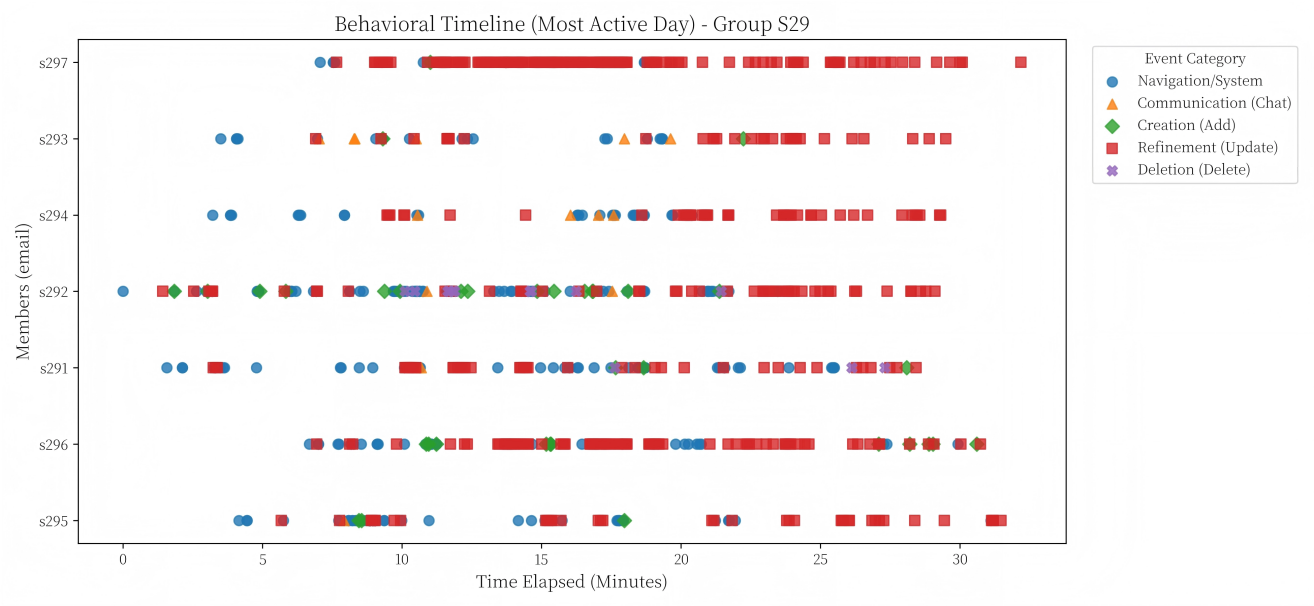
Figure 8
Behavioural Timeline of Individual Member Contributions (High-Performing Group S29)
In S29's timeline (Figure 8), refinement and update actions occur throughout the session, and creation and add events appear in structured intervals. Multiple members remain active across the session rather than only at the beginning. This pattern is consistent with an efficient build-then-refine workflow.
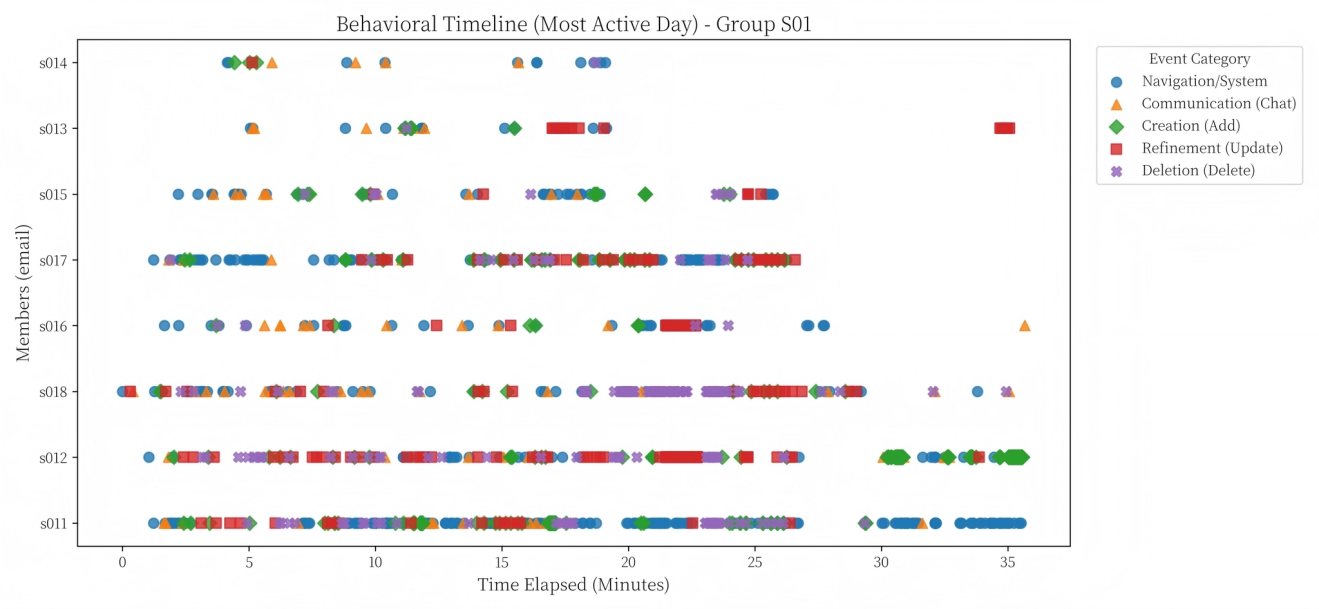
Figure 9
Behavioural Timeline of Individual Member Contributions (Low-Performing Group S01)
In S01's timeline (Figure 9), chaotic bursts of activity are punctuated by extended idle periods. Unlike the higher-performing groups, S01 exhibits deletion cycles in which previously created content was repeatedly removed and recreated. The group's 18,652-event anomaly combines genuine uncoordinated activity with a large share of system artefacts (Section 5.3.5), so event volume alone is not read as collaboration intensity. The focal-day window excludes activity on other days, including out-of-class refinement, which is itself an engagement signal. Between-group differences in total activity across the full logging period are therefore not compared in this chapter.These visual patterns corroborate the teacher's observation that this group struggled with both tool navigation and interpersonal coordination.
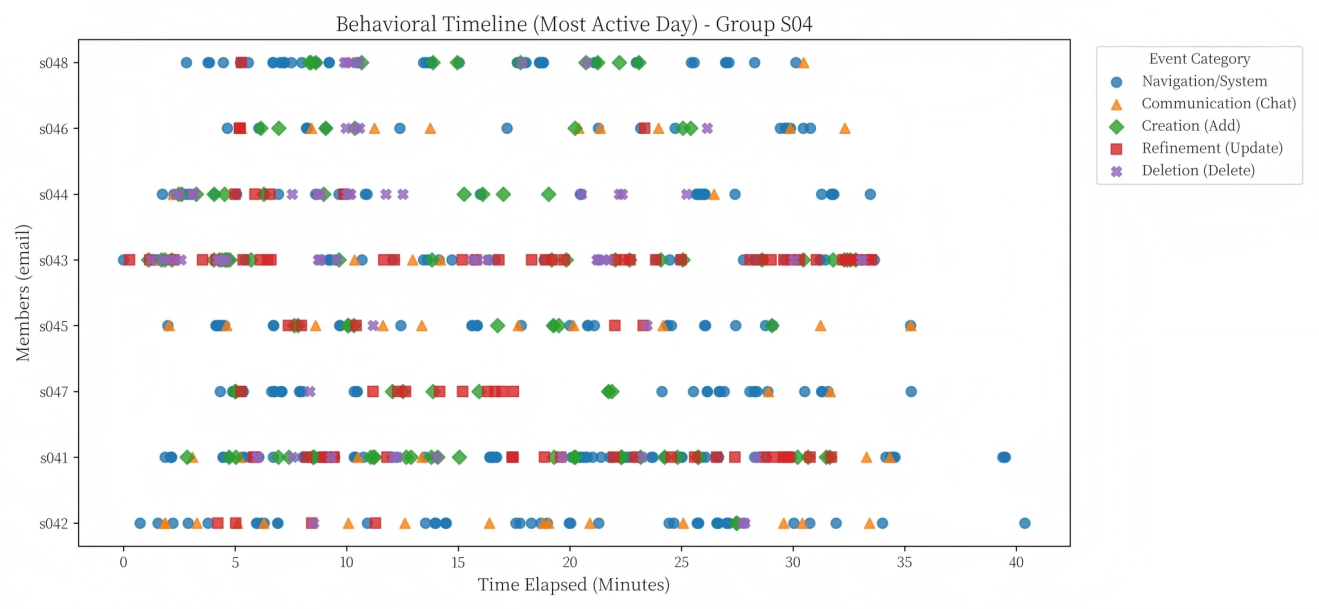
Figure 10
Behavioural Timeline of Individual Member Contributions (Mid-Performing Group S04)
In S04's timeline (Figure 10), episodic clusters of activity recur throughout the session, with Navigation/System and Creation/Add events interspersed and no clearly delineated refinement phase. Repeated content-uploading cycles are visible: the group confused panoramic and planar images, which led to redundant scene creation rather than progressive task completion, as the teacher had observed.
5.3.5 Comparative Process Analysis: Integrating Timelines, Heatmaps, and Gini
This section integrates the three analytical lenses, heatmaps (when and how), timelines (who), and Gini coefficients (how evenly), to compare the collaborative processes of S29, S04, and S01.
Group S29 (High-Performing): Sustained Engagement and Balanced Participation.The teacher evaluated Group S29 (Score = 90) as highly efficient and complete, and the process data match this assessment. The temporal heatmap and behavioural timeline (Figures 5 and 8) show a dense, continuous stream of productive actions spanning the entire session. Multiple members remained active throughout the process rather than only at the beginning. A prominent feature of S29 is the long, steady band of refinement operations, accompanied by intermittent creation and navigation actions from other members, which suggests an efficient build-then-refine progression. Updates were not isolated spikes but part of an ongoing, rhythmic production flow, representing a clear state of collective engagement. S29 also achieved the lowest Gini coefficient among the three cases (Gini = 0.1980), indicating that Effective Output was distributed evenly across all log-observed active members. High performance here is associated with both sustained process intensity and shared responsibility: no single individual dominated the workload.
Group S04 (Mid-Performing): Fragmented Effort Under a Knowledge Bottleneck.The teacher described Group S04 (Score = 80) as diligent but constrained by conceptual misunderstandings, specifically the confusion of panoramic and planar images. The timeline (Figure 10) visually captures this struggle: several members contributed actions, but their production episodes appear highly fragmented, and the heatmap (Figure 6) shows a noticeable alternation between navigation operations and actual output actions. Compared with S29, S04 lacks long, continuous stretches of concentrated refinement and instead worked in episodic clusters, a pattern that reflects intense trial-and-error behaviour under a persistent knowledge bottleneck. The inequality measure fell in the middle (Gini = 0.4054): more than one member contributed, but the group did not share productive output as evenly as S29. S04 represents effortful collaboration whose high process intensity did not translate into streamlined task progression.
Group S01 (Low-Performing): Severe Difficulties, Task Drift, and the Activity Anomaly.Group S01 (Score = 53) exhibited the strongest signs of task drift and collaboration breakdown. The teacher noted excessive scene creation and severe group friction. The temporal heatmap for S01 (Figure 7) reveals a striking visual anomaly: while S29 and S04 peak at around 50 events per two-minute bin, the colour intensity for S01 explodes across two adjacent two-minute bins, which together contain over 17,000 events. The peak bin holds about 9,500 events, roughly 80 logged events per second, which exceeds what eight students can physically produce. The burst is therefore largely a logging artefact rather than behaviour, as the post-hoc investigation below shows.
The extreme event volume of Group S01 (18,652 events) requires a more nuanced explanation than simple prank behaviour. Student interviews described playful misuse of the concurrent editing feature (T3_4: "T5 put so many buttons and stickers in our scene"), but the sheer volume, averaging over 77 events per minute across the four-hour logging window on 12 December, cannot be fully explained by intentional pranks alone. A post-hoc investigation revealed that a substantial portion of these events were system artefacts: two students discovered that holding the Enter key generated rapid-fire log entries, and used a physical object to keep the key depressed, producing thousands of spurious events. Of S01's 18,652 logged events, 17,044 (91.4%) were a single repeated action (scene music volume updates) produced by two accounts within two adjacent two-minute bins, a peak rate of about 80 events per second that no manual workflow can produce. After removal of this artefact burst, S01's genuine activity amounts to 1,608 events, comparable to the other case groups.This behaviour, while playful in intent, exposed a critical platform design vulnerability: the system lacked rate-limiting or anti-spam mechanisms. The 18,652 event count is therefore interpreted as a compound of genuine activity, prank actions, and system noise, a finding with direct implications for platform design in Cycle 3.
S01 also displayed substantially higher collaboration inequality (Gini = 0.75), indicating that a very small subset of members generated this massive volume of actions while the rest of the group disengaged. This corrected Gini should nevertheless be interpreted with caution: the Damgaard-Weiner correction was developed for ecological size-distribution data, and its application to CSCL event logs has not been independently validated. The case illustrates a key finding: high interaction volume does not equal productive collaboration. When actions are highly concentrated, repetitive, and uncoordinated, they produce low-quality outcomes.
Sensitivity Analysis. To assess whether the extreme event volume distorted the conclusions, the volume-spam artefact was removed (17,044 events, 91.4% of S01's total; Section 5.3.5). This reduces S01's event count from 18,652 to 1,608, and its Gini from 0.75 to 0.60. S01 remains the least equal of the three groups by a wide margin, so the inequality finding is robust to artefact removal.
Validity Threat: Does High Gini Always Indicate 'Bad' Collaboration?High Gini coefficients typically signal unequal participation, which is generally undesirable. In mentorship or expert-novice configurations, however, a high Gini may reflect effective knowledge transfer rather than dysfunctional domination; for example, one skilled student might legitimately lead hotspot design while peers observe and learn. The log data cannot distinguish between these two interpretations, so the Gini coefficient is interpreted alongside qualitative evidence (teacher assessments and focus group interviews) rather than as a standalone collaboration quality metric.
Across the three cases, the combined evidence supports two conclusions. First, performance differences depend on how a group organises activity over time: sustained progression (S29)produces better results than cycling content uploads (S04) or fixating on a single flawed prototype (S01). Second, collaboration quality depends on how evenly members contribute, not merely how many actions they generate: high-volume, low-diversity interaction (S01) does not advance a project. Figure 11 visualises the Gini comparison across the three groups.
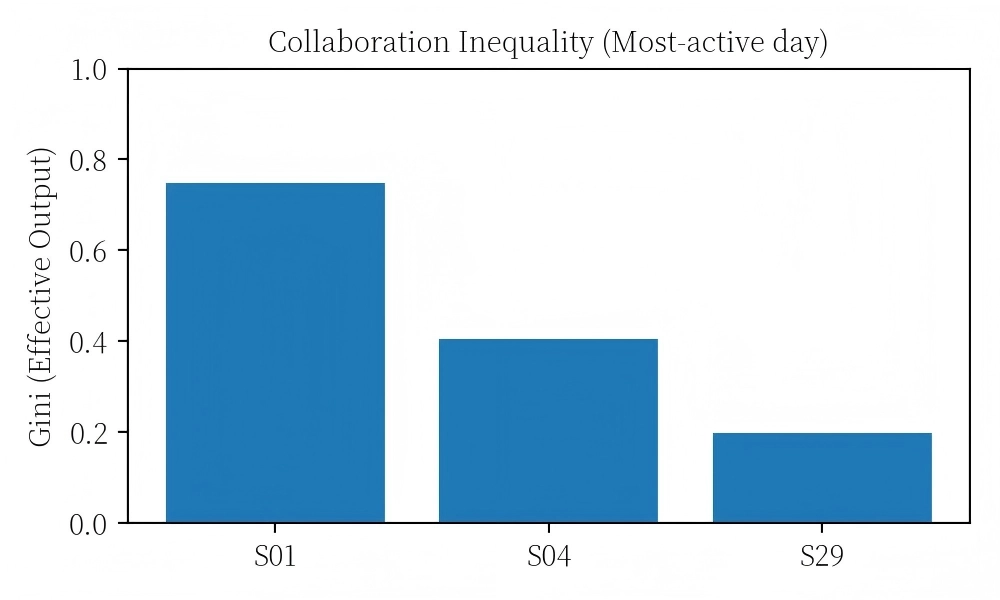
Figure 11
Gini Coefficients for Effective Output Across Three Typical Groups
5.3.6 Summary of Process Patterns
Table 25
Summary of Collaborative Process Indicators Across Three Typical Groups
Group | Score | Total Events | Gini (Eff. Output) | Heatmap Pattern | Teacher Comment (Core Focus) |
|---|---|---|---|---|---|
S29 | 90 | 831 | 0.1980 | Phased: build → refine; moderate media search. | Highly complete; very high efficiency. |
S04 | 80 | 691 | 0.4054 | Cycling content uploads; no clear refine phase. | Diligent but confused concepts; redundant scenes. |
S01 | 53 | 18,652 | 0.7493 | Dominant refinement bursts; high deletion; low creation. | Misunderstood task; intra-group conflict; 200+ scenes. |
1. Distributed and Phased (S29). Balanced contribution and temporally organised activity produced a high-quality product. This is the signature of collective engagement.
2. Moderately Concentrated and Cycling (S04). Effort was sustained but misdirected: the group looped within a single task phase because of conceptual bottlenecks.
3. Highly Concentrated and Burst-Dominated (S01). One or two members generated most events while others engaged in conflict or deletion. The result was massive event volume but minimal task completion.
This three-pattern typology is a descriptive framework that future studies can test with larger samples.
5.4 Qualitative Insights: Unpacking the Mechanisms of Engagement and Difficulties
The log data show what happened; the focus group interviews help explain why these patterns emerged. Three focus group sessions were conducted after the intervention (Section 3.4.3), addressing the two aspects of RQ2: the elements that develop competence and the challenges encountered. The interviews converged with the log data and showed how students experienced the workflow.
5.4.1 Catalysts for Sustained Collaboration: AIGC and Concurrent Assembly (RQ2)
The interviews identifiedtwo elements that most effectively improved students' engagement and competence: teacher-mediated AIGC tools and the concurrent assembly feature of the CLEVR platform.
Curatorial Reasoning as a Competence Booster.Students explicitly identified AI generation as their most satisfying experience because it completely removed the barrier of traditional drawing skills. Student T1_3 described the instantaneous generation of high-quality assets: "You just type a few words, and 'whoosh', the Steel City appears! It felt very sci-fi, with a cyberpunk vibe." Similarly, student T2_4 noted, "The AI-generated images were so dreamy! Much better than what I could draw." By offloading the mechanical burden of drawing to AI, students focused their cognitive resources on storytelling and aesthetic choices, which directly supported their Digital Content Creation practices. (In the Cycle 2 interviews, students used the name "Steel City" for the Gear City theme.)
From Turn-Taking to Concurrent Collaboration.Traditional group work often forces sequential collaboration, but the VR platform allowed concurrent participation. Student T3_2 highlighted this fundamental shift: "The best part was that everyone could throw things in! Before, when making PPTs, we always fought for the mouse. This time, we didn't have to. I uploaded my own pictures, added my own voice, and we pieced it together." This concurrent assembly design eliminated the physical bottleneck and created a genuine sense of shared ownership.
The Immersive Moment.Students reported their strongest engagement when they tested their integrated products. Connecting scenes and adding audio created powerful sensory feedback. Student T2_1 described the impact of spatial audio: "I thought the background music was just okay at first. But when I put on the headphones and VR glasses... it really felt like being underwater. The sound was muffled and very real." (T2_1)"
5.4.2 Challenges and Barriers: Physical, Cognitive, and Collaborative Difficulties (RQ2)
Although AIGC and concurrent assembly drove collective engagement, students also encountered significant challenges, which fall into three categories.
Physical Difficulties: Curating AI-Generated Images.Although Cycle 2 eliminated manual panoramic photography, students encountered new technical barriers when working with AI-generated images. Student T1_4 explained, "It was too hard to get the right picture! We typed the prompt many times, but the AI kept giving us images with weird angles or wrong colours. We couldn't use them directly." Student T2_4 echoed this, saying that "the AI didn't understand our words" and that getting a usable image felt "like an earthquake of retries". Student T1_3 added, "The teacher had to help us rewrite the prompts again and again. The AI pictures looked good only after the teacher fixed our words." These experiences show that AIGC did not eliminate technical barriers; it transformed them. Instead of struggling with camera hardware, students now struggled with prompt engineering, and the cognitive load shifted from manual operation to human-AI communication. This finding directly informed the Cycle 3 redesign, which introduced explicit prompt-crafting scaffolding (see Chapter 6).
Cognitive Difficulties: The Language Barrier.The English interface of the platform created high cognitive load and fear. Student T1_3 admitted, "I only knew 'upload' and 'save', and guessed the rest. I was terrified that pressing the wrong button would delete the whole scene." This language barrier turned simple navigation into a high-risk guessing game, and multiple students (T1_5, T3_3) repeatedly demanded a Chinese interface.
Team Coordination Challenges: Uncoordinated Edits and "Easter Eggs".Student interviews described playful misuse of the concurrent editing feature. Student T3_4 reported, "T5 put so many buttons and stickers in our scene, packed tightly together, calling them 'Easter eggs'. We spent half an hour deleting them, and we almost gave up." Student T3_5 admitted with a laugh: "I only placed ten." T3_2 corrected him: "Ten? You obviously placed twenty!" Student T3_5 admitted placing the items but downplayed the number. This episode is consistent with the bursty Deletion and Refinement clusters in the case-group heatmaps (Section 5.3.5).: without coordination rules, concurrent editing can degenerate into conflict.
5.4.3 Student-Proposed Scaffolding and Future Iterations
Students did not just complain about friction; they actively proposed solutions. To address team coordination challenges, student T2_5 suggested implementing a task checklist to track progress, and T3_5 suggested system-level constraints, such as an anti-prank feature or granting the group leader exclusive deletion permissions.
Students also expressed a strong desire to expand their AI competencies. They asked to train their own AI models (T1_5), to generate 3D models and animations instead of static images (T3_2), and to use AI for professional voice modulation (T1_2). These requests indicate that students had moved past basic digital literacy and were now demanding advanced digital creation tools.
The DS decline also raises a measurement context hypothesis. The Safety items were originally framed for general digital-use contexts, not for controlled VR laboratory environments. Items about protecting personal information may have lower ecological validity when students use institutional equipment in a supervised setting. The decline may thus partly reflect context-driven response attenuation rather than genuine competence erosion, a possibility that Cycle 3 was motivated by this possibility to hold an informal AI-ethics reflection discussion.
5.5 Discussion: Synthesising Competence, Flow, and Difficulties
This section synthesises the quantitative and qualitative findings of the cycle and addresses the research questions directly.
5.5.1 Answering RQ1: The Quantitative Shift in Digital Competence
To answer RQ1, the overall impact of the redesigned intervention on students' digital competence was evaluated. The quantitative results (Section 5.2) reveal a differentiated pattern of competence change across the five DigComp dimensions. Information and Data Literacy (dz = 0.49, p < .001) and Digital Content Creation (dz = 0.24, p = .00 8) improved significantly, and the composite score improved modestly(dz = 0.22, p = .013). Problem Solving showed no meaningful change (dz = 0.01, p = .903), Communication and Collaboration showed a small, non-significant gain (dz = 0.14, p = .107), and Digital Safety declined significantly (dz = −0.20, p = .026). The redesigned pedagogy thus achieved its primary objective of supporting creative competence, but it also exposed a dual-edged nature of AI-assisted workflows: efficiency gains coexisted with a safety-awareness trade-off.
Item-level analysis sharpens this picture. The IDL gain was concentrated in the source-evaluation item, which rose from 3.50 to 4.17 (dz = 0.59, p < .001), while the search-skill item barely moved (dz = 0.08): the AIGC workflow trained students to judge sources, not merely to find them. The CC pattern was internally split. The collaborative-work item improved significantly (3.47 to 3.85, dz = 0.33, p = .0003), but the cautious-communication item declined (4.63 to 4.50, dz = −0.18, p = .045), and the two movements largely cancelled each other out. All three Problem Solving items remained flat (dz between −0.08 and 0.10).
The DS Paradox: Why Did Digital Safety Decline? The decline in Digital Safety (from M = 4.49 to M = 4.36) is the Cycle 2 result that most needs a theoretical explanation, and the item-level data localise it precisely: the personal-information item dropped significantly (4.65 to 4.40, dz = −0.29, p = .001), while the password item was unchanged (dz = −0.02). T hree competing explanations follow. The first is scaffolded desensitisation: students who routinely used AI-generated content without encountering negative consequences may have developed a complacent attitude towards digital risk. Their post-test responses reflect reduced perceived importance of protecting personal information, not because they knew less, but because they cared less, having experienced a lower-friction workflow in which everything simply worked. The second is the measurement context hypothesis (Section 5.4.3): in a supervised laboratory with institutional equipment, privacy-protection scenarios were largely absent, so the relevant items may have lost salience regardless of any competence change. Dimension-level results are exploratory (Section 3.4.1).
The third is regression to the mean combined with a ceiling effect. Digital Safety started from the highest baseline of the five dimensions (M = 4.49), and across the five dimensions the baseline-change association is strongly negative (r = −.92, computed from the pre- and post-test means in Table 20, and reported descriptively across the five dimensions): the higher a dimension started, the less it gained. On this account, at least part of the decline is a statistical artefact of an unusually high starting point rather than a loss of competence. The three explanations are not mutually exclusive, and the present design cannot separate them.
Notably, the copyright-awareness item improved (dz = 0.18, p = .049), which suggests that students did not become uniformly less safety-conscious: the decline is specific to privacy and cautious communication rather than to all safety-related dispositions. The decline also qualifies the design claim of Chapter 4: safety-relevant decisions were deliberately built into the Cycle 2 workflow, yet the safety dimension still declined. Embedding safety decisions in a workflow does not by itself sustain safety self-assessment. Cycle 3 also included an informal AI-ethics reflection discussion on these issues (see Chapter 6).
The PS Puzzle: Why No Growth in a Problem-Rich Task?As reported in Section 5.2.1, Problem Solving showed no meaningful change, and students' own accounts explain why: when manual capture failed, groups switched wholesale to AI-generated assets, and the generation step offered ready-made options rather than problems to solve.The redesigned workflow eliminated the hardware problems that could have developed problem-solving, and teachers repaired the prompts that failed. What looked like problem-solving was often selection from AI-generated alternatives rather than the independent formulation of solutions. The AIGC scaffold changed the nature of the problem-solving task instead of developing deeper problem-solving capacity. This shows that scaffolding can be competence-enhancing or competence-substituting, and that the difference is a design choice, a distinction that directly shaped the Cycle 3 task design. The two null results differ in mechanism, however: in Cycle 1, students practised troubleshooting on broken tools (Section 4.5), whereas in Cycle 2, selection replaced formulation as AI supplied ready-made assets. A two-item subscale may also have been insensitive in both cycles.
5.5.2 Answering RQ2: Collaboration Dynamics and Student Engagement
To answer RQ2, the specific elements that drove engagement were identified. The findings confirm that teacher-mediated AIGC tools and concurrent assembly acted as the primary catalysts. The quantitative log data (the low Gini coefficient in the high-performing group) and the qualitative interviews (students praising "no fighting for the mouse" and instant AI generation) support the same theoretical mechanism: reducing technical barriers freed students' cognitive resources for storytelling, and this lower-friction environment enabled students to enter and sustain collective engagement.
The PS null result introduces a critical nuance. Although students reported high satisfaction with AI-assisted work, the kind of problem solving they practised was fundamentally different from independent reasoning: the task shifted from "create from scratch" to "select from options". Future iterations should therefore distinguish competence-enhancing scaffolds (tools that develop skills) from competence-substituting scaffolds (tools that replace skills).
5.5.3 Answering RQ2: Identifying Challenges and Informing Scaffold Design
The triangulated data revealed the challenges of unstructured collaboration. Unstructured concurrent platforms generated severe technical and team coordination difficulties. The extreme event volume in Group S01 (18,652 events), now understood as a compound of genuine activity, prank actions, and system noise, corresponds directly to the uncoordinated edits and Easter eggs reported in the interviews. The transformed technical barriers, from camera hardware to prompt engineering, also represented a new barrier that Cycle 1 did not anticipate.
Consequently, future iterations should introduce specific systemic scaffolding. Students explicitly requested progress trackers and role-based deletion permissions, and these features are pedagogical structures required to prevent collaboration breakdown, not optional add-ons. The prompt-engineering challenges revealed in Section 5.4.2 further suggest that teacher-mediated asset support requires explicit scaffolding for human-AI communication beyond tool access.
5.6Interim Summary
This chapter presented an evaluation of the redesigned VR storytelling pedagogy. Section 5.2 showed significant quantitative gains in Information and Data Literacy and Digital Content Creation, a significant decline in Digital Safety, a flat Problem Solving outcome, and a modest but significant composite gain (dz = 0.22). Section 5.3 introduced a process analytics framework that used event classification, temporal heatmaps, behavioural timelines, and Gini coefficients to make collaborative actions visible: the high-performing group combined balanced participation with a build-then-refine rhythm, while the low-performing group produced massive event volume through concentrated, uncoordinated activity. Section 5.4 triangulated these logs with qualitative interviews and explained the mechanisms behind the patterns.
Together, the data reveal a clear pedagogical mechanism. Teacher-mediated AIGC tools and concurrent assembly reduced technical barriers and acted as strong supports for sustained productive collaboration. However, the data also exposed the risks of unstructured freedom: without proper scaffolding, concurrent environments generated coordination chaos. The Digital Safety decline and the Problem Solving null result further show that teacher-mediated asset support is not an unalloyed good: it transformed the nature of competence development in ways that demand careful pedagogical design, and the efficiency gains of AI-assisted workflows must be balanced deliberately against safeguards for critical thinking, safety awareness, and genuine problem-solving depth. These findings complete the evaluation phase of this DBR cycle and set the design agenda for Cycle 3.
5.7 Triangulation Matrix: Quantitative-Qualitative-Log Convergence
Table 26
Core Finding Triangulation Status
Core Finding | Quantitative (Pre-Post) | Qualitative (Interviews) | Log Data (Gini/Heatmap) | Convergence Status |
|---|---|---|---|---|
IDL improved | sig., dz = 0.49 | general praise for AIGC selection | – | Moderate: quantitative supported, log unmeasured |
DCC improved | sig., dz = 0.24 | "whoosh" (T1_3), "dreamy" (T2_4) | S29 POR = .61 vs S04 = .32, S01 = .43 (cleaned) | Strong convergence |
CC marginal | n.s., dz = 0.14 | "everyone could throw things in" (T3_2) | S29 low Gini | Partial: composite flat, collaboration item improved, behaviour positive |
PS null | n.s., dz = 0.01 | "we just used the AI-generated images" (T1_4) | – | Convergent null: both sources agree |
DS declined | sig., dz = −0.20 | – | – | Weak: quantitative signal lacks qualitative depth |
Low Gini associated with high performance | – (not tested statistically) | "high efficiency" (teacher S29) | S29 Gini = 0.20, Score = 90 | Strong convergence |
High event volume does not equal high quality | – | "Easter eggs" prank (T3_4) | S01: 18,652 events, 91% artefact burst, Score = 53 | Strong convergence |
Technical barriers transformed, not eliminated | – | "I only knew upload and save" (T1_3) | S04 cycling pattern | Moderate: two-source convergence |
Note.sig. = statistically significant; n.s. = not significant;n/a = no data available. dz = Cohen's d for paired designs.
Five of the eight findings show strong or moderate convergence across multiple data sources. The two most theoretically informative exceptions, the PS convergent null and the DS decline, directly informed the Cycle 3 redesign priorities (see Chapter 6).The triangulation matrix confirms that the mixed-methods design captured complementary aspects of the intervention's effects while identifying specific gaps where additional evidence would strengthen the claims.
5.8 Key Findings and Implications for Cycle 3
The teacher-mediated asset redesign eliminated the broken panoramic capture step and produced significant gains in Information and Data Literacy (dz = 0.49) and Digital Content Creation (dz = 0.24), together with a modest but significant composite gain (dz = 0.22).
Digital Safety showed an unexpected decline (dz = −0.20), concentrated in the personal-information item, exposing a critical risk: when AI streamlines content production, students may offload safety-critical judgement to the tool rather than exercising their own evaluative reasoning.
Problem Solving showed no growth (dz = 0.01), and the interviews revealed why: students excelled at choosing among pre-generated options but showed limited evidence of independent problem formulation. AIGC efficiency must therefore be calibrated to preserve generative cognitive demand.
Process logs revealed that concurrent assembly catalysed sustained productive collaboration only when combined with proper scaffolding; without structural support, the same freedom generated coordination chaos and technical frustration.
Cycle 2 therefore confirmed the core design hypothesis in a qualified form: teacher-mediated asset production improved overall digital competence while removing technical barriers, but it also revealed emergent challenges in coordination, safety awareness, and problem-solving depth that Cycle 1 did not anticipate. These findings motivated two design decisions for Cycle 3: testing the boundary condition with a high-achieving subsample to probe the expertise reversal effect, and introducing multimodal task integration to deepen collaborative interdependence and restore generative demand. Chapter 6 reports this third cycle.
Chapter 6: Cycle 3 Findings: Testing with a High-Achieving Cohort
Cycle 2 demonstrated that teacher-mediated asset production produced significant gains in Information and Data Literacy and Digital Content Creation, together with a modest composite gain, while revealing new challenges: coordination difficulties in concurrent editing, a flat Problem Solving outcome, and a decline in Digital Safety. One further gap persisted. The collaborative process remained superficial: students divided tasks mechanically to save time, with one writing text, another choosing images, and a third arranging scenes, and they actively avoided the complex negotiation intrinsic to collaborative creation. This dynamic raised a pointed question: will students engage in deeper collaboration if the task itself makes superficial division of labour impossible? This chapter reports Cycle 3, which tested this question with a purposively selected high-achieving science-track subsample (N = 47) from the same school and grade as Cycles 1 and 2, using a multimodal task integration as an additional complexity layer. Section 6.1 explains the boundary testing rationale and its interpretive caveats, Section 6.2 the problem analysis behind the redesign, Section 6.3 the implementation, Section 6.4 the quantitative findings, Section 6.5 the qualitative insights, and Section 6.6 the contributions to the design principles formulated in Chapter 7.
6.1 Cycle 3 Design, Participants, and Data Collection
6.1.1 Boundary ConditionTesting: Why This Sample?
Cycles 1 and 2 followed the DBR norm of testing the intervention with mainstream populations, using general Grade 7 classes (N = 41 and N = 130) to assess how collaborative VR creation works under normal classroom conditions. The answer was cautiously positive: when technical barriers are reduced, students show measurable digital competence gains. The DBR methodology, however, also demands boundary condition testing (Cobb et al., 2003). A design principle that works only for the average student in the average classroom has limited practical utility. High-achieving students constitute one such boundary: they enter with stronger knowledge bases, higher baseline digital competence, and different motivational profiles. If the design principles from Cycles 1 and 2 need fundamental rethinking for this population, their generalisability is narrower than initially asserted; if they endure with minor modification, their strength is fortified (Collins et al., 2004).
Three theoretical considerations motivated the selection of a science-track subsample. The first is ceiling-limited measurement: participants who score near the instrument maximum at pre-test have limited room to show improvement at post-test, even when genuine competence growth occurs (Dimitrov & Rumrill, 2003), and high-achieving groups are prone to this pattern because their initial competence is already near the measurement ceiling. The second is the expertise reversal effect (Kalyuga, 2007): scaffolding that helps novices may be useless or even detrimental for advanced learners, and the teacher-mediated asset support that freed Cycle 2 students from production burdens may remove exactly the productive struggle that drives growth in high-achieving students. The third is self-selection: science-track students chose a demanding curricular line on the basis of prior achievement and interest, and they bring stronger spatial reasoning, structured problem-solving strategies, and greater willingness to persist through difficulty, all of which may change how they respond to an open-ended creation task. Cycle 3 was therefore planned as a principled boundary test: the question was not whether the intervention produces identical results with a different sample, but whether the design principles still function when student characteristics push them to the edge of their application range.
6.1.2 Baseline Difference and The Interpretation Caveat
Pre-test scores confirmed the expected population difference. Cycle 3 students scored significantly higher than Cycle 2 students on four of the five dimensions: IDL (4.11 vs. 3.66, d = 0.56, p = .001), CC (4.49 vs. 3.99, d = 0.72, p < .001), DCC (4.17 vs. 3.88, d = 0.34, p = .047), and PS (4.29 vs. 3.96, d = 0.43, p = .012). DS did not differ significantly (4.57 vs. 4.46, p = .370). These elevated baselines reflect the self-selection of the science-track population, and they constrain the interpretation of pre-post gains: students who start close to the ceiling cannot show large absolute improvement even when learning has genuinely occurred (Dimitrov & Rumrill, 2003).
Cycle 3 evidence is therefore read as illustrative of how the intervention works under high-baseline conditions, not as evidence of differential effectiveness across populations. The design principles that emerge from Cycle 3 are annotated as applicable to high-ability learners rather than global.
6.1.3 Propensity score matching and Cross-cycles comparison
A propensity score matching (PSM) analysis was conducted to address the baseline differences. Each Cycle 3 participant was matched with a Cycle 2 student on pre-test total score and gender, using nearest-neighbour matching without replacement with a caliper of 0.2 standard deviations of the pooled pre-test score (Stuart, 2010). Forty-five of the 47 Cycle 3 students were successfully matched. Balance diagnostics show that the standardised mean difference in pre-test total score fell from 0.59 before matching to 0.01 after matching, indicating excellent balance.
The matched comparison revealed one notable pattern. The CC decline in Cycle 3 (mean change = −0.20) was larger than that of the matched Cycle 2 students (mean change = −0.04), t(88) = −1.91, p = .059, which is consistent with, though not decisive for, a contribution of multimodal task complexity beyond population differences (p = .059; see Section 7.5.6). Gains on the other dimensions did not differ significantly between the matched groups (all p > .36).
PSM cannot adjust for unmeasured selection variables. Academic motivation, parental support, and the prior interest in technology that led students to select the science track were not measured and could not enter the matching procedure (Rosenbaum, 2002). The PSM comparison therefore remains exploratory: it offers suggestive evidence about differential response patterns, not conclusive evidence about intervention effectiveness across ability levels.
6.2 Problem Analysis and Design Refinement
6.2.1 Identifying the Collaboration Gap: The Need for Multimodal Integration
To push students beyond simple asset curation, the Cycle 3 intervention had to create a situation in which mechanical task division would not work. The design team reasoned that if students had to integrate different types of media into one coherent spatial narrative, genuine negotiation would become unavoidable: no single student could handle every dimension alone, and each member would need to coordinate creative vision, technical implementation, and aesthetic judgement.
To set a high integration standard, the instructor presented Digital Dunhuang, a professional-quality immersive experience that integrates spatial navigation, visual art, text explanation, and audio guides into a coherent whole (Bao & Bowen, 2025). Guided by the teacher, students analysed the project and identified its core design logic: a complete VR story orchestrates panoramas, background music, voiceover narration, explanatory text, still images, and navigation paths, and together these elements determine whether the audience can follow the producer's intention. Digital Dunhuang is the flagship digitisation programme of the Dunhuang Academy and is documented in peer-reviewed literature (Hu, 2018; Yu et al., 2022); it served here as an inspirational model, not as an educational intervention.
Cycle 2 had shown that students can create individual assets once the production burden is removed. What was missing was a systematic approach to connecting diverse elements into one package. The multimodal integration requirement was developed to fill this gap by making the connection itself the central task.
6.2.2 Refined Intervention Design: The multimodal task
Cycle 3 involved a highly complex multimodal VR storytelling task modelled on Digital Dunhuang. Students collaborated to create a hub-and-spoke VR space: a central panoramic scene linked to several sub-scenes through interactive navigation hotspots. Each group had to produce six different types of media: panoramic skybox images, background music, narrative voiceover, explanatory text, additional still images, and logical navigation paths from scene to scene.
To prevent superficial collaboration, the teacher intentionally used two complete world-building themes (Pearl Kingdom and Gear City), selected from the students' own brainstormed candidates (Section 6.3.2). This decision forced groups to negotiate which world to build, how to allocate the world-building assets, and how to resolve conflicting creative visions. Table 27 outlines the required multimodal elements and their pedagogical purposes.
Table 27
Multimodal VR Elements and Asset Sources in Cycle 3
VR Element | Output Requirement | Source | Pedagogical Purpose |
|---|---|---|---|
VR Panoramas (Skyboxes) | 6 panoramic images of distinct locations | teacher-mediated (Skybox AI) | Build immersive physical environment |
Background Music | Context-appropriate audio | CLEVR system library (20,000+ CC tracks) | Set emotional tone without copyright issues |
Narrative Voiceover | Audio narration per scene | teacher-mediated (Jimeng) | Provide accessible narrative guidance |
Explanatory Text | Written descriptions | Student-authored | Develop information literacy and writing |
Still Images | Supplementary visuals | teacher-mediated (Nano-Banana 2) | Support visual storytelling |
Navigation Paths | Bidirectional hotspot links | Student-configured in CLEVR | Exercise spatial logic and user-centred design |
6.3 Implementation of Cycle 3
6.3.1 Participants and Context
The participants were 47 Grade 7 students enrolled in the science and technology curriculum at the same school as Cycles 1 and 2. All had completed the standard technology curriculum covering basic digital operation skills, internet safety, and an introductory programming course. None had prior knowledge of VR creation or the CLEVR platform. The instructor assigned students to groups of five to six, balancing gender and academic performance.
6.3.2 Procedure and Activities
The Cycle 3 intervention followed a structured four-phase process over ten sessions. In Phase 1 (Case Analysis and Spatial Planning), the instructor introduced the Digital Dunhuang project, students examined its multimodal elements and navigation logic, and each group produced a physical story map on paper (Figure 14), designating one central scene as the hub and five adjacent scenes as spokes, and establishing a shared visual language to prevent later aesthetic disputes. In Phase 2 (Multimodal Asset Curation), the instructor distributed complete teacher-developed asset packages, including six 360-degree panoramas per world, a story poster, six picture books with explanatory text, narrative voiceovers, background music, and ambient sound effects; students evaluated, chose, and customised these assets, coordinating curation tasks and jointly rejecting assets that failed the team's aesthetic benchmark. In Phase 3 (VR Assembly and Spatial Integration), students assembled the VR environment in CLEVR: they created the six scenes with their chosen panoramas, inserted text, posters, picture books, and voiceovers, selected background music from the CLEVR library, and programmed navigation paths following their hub-and-spoke blueprint; the lost tourist episode described in Section 6.5.2 occurred during this phase. In Phase 4 (Testing, Refining, and Final Review), groups tested their finished environments, repaired broken links and misplaced elements, adjusted visual assets for different viewing angles, and presented their VR stories to the class for peer review. During the later sessions, the instructor also led an informal question-driven discussion on AI-related risks. Students were asked what infringements or crimes AI might enable, and they raised concerns including copyright infringement in AI-generated images and voice-mimicking fraud after face-swapping, concluding that caution was warranted. This exchange was conversational rather than a formal safety scaffold (see Section 7.6.3).
6.3.3 Teacher-Mediated Asset Production Protocol
A key design choice in Cycle 3 was the resolution strategy for multimodal asset production. As framed in Section 1.1.4, generative tools in this study serve as instructor-directed scaffolds, not student-visible learning tools: students develop digital competence by collaboratively building VR content rather than by operating generative systems themselves. The instructor followed a five-step protocol to produce the themed asset packages.
In Step 1 (theme selection), students brainstormed candidate worlds in Session 1, and the instructor selected the two themes with adequate narrative complexity and visual differentiation: Pearl Kingdom (an underwater fantasy world) and Gear City (a steampunk city setting). In Step 2 (world building), the instructor used a large language model (Kimi) to develop each world into a full setting with six locations, each with its own architectural characteristics, cultural definition, and narrative role, and then reviewed and edited the outputs for cultural neutrality, didactic value, and alignment with the DigComp targets. In Step 3 (visual asset generation), the instructor used Nano Banana 2 to produce, for each world, a story poster establishing the visual identity, six picture books (one per location) combining explanatory text with illustrations, and a map showing the hub-and-spoke spatial structure; all prompts were designed to enforce consistent art style, aspect ratio, and K-12-appropriate content. In Step 4 (voiceover generation), the instructor used Jimeng's text-to-speech function to generate a 30- to 60-second narration for each scene, with scripts adapted from the Step 2 location descriptions and constrained to oral style and age-appropriate vocabulary. In Step 5 (panorama generation), the instructor used Skybox AI to generate six 360-degree images per world, iterating prompts to achieve visual consistency across the set with a distinct atmosphere for each location.
The total instructor investment was about six hours per world. Students were not involved in these five steps; their first contact with the assets came in Phase 2, when they began curating, reviewing, and combining the materials into their VR storybooks. Keeping production and integration separate was an explicit design goal: the mechanical production burden was absorbed by the instructor so that students' cognitive resources could go to collaborative construction.
6.3.4 Data Collection Scope
Data collection followed the same pre-post design as Cycles 1 and 2. Students completed the validated DigComp instrument at the beginning of Session 1 and again at the end of Session 10. Focus group interviews were held in two rounds: after Cycle 2, three sessions of five students each, organised by story theme (Section 3.4.3); and after Cycle 3, six students selected by performance level (two high-performing, two mid-performing, and two low-performing), one week after the project ended. The second round was not audio-recorded; findings from this round are reported from the instructor's field notes. Cycle 3 data collection did not include platform log analysis of the kind conducted for Cycle 2. Under the hub-and-spoke classroom model, one student operated the computer while peers discussed and directed, so log data would capture only the single operator's actions rather than the group's distributed collaboration. The collaborative dynamics described in this cycle therefore rely on focus group interviews and instructor observations.
6.4 Evaluation Phase I: Quantitative Results
This section addresses RQ1 for Cycle 3.
6.4.1 High Baseline and No Significant Gains
Paired-samples t-tests compared pre-test and post-test scores (N = 47) across the five DigComp dimensions, following the same analysis plan as Cycles 1 and 2 (Section 3.5.1). Table 28 reports the full descriptive and inferential statistics, and Figure 12 visualises the pre-post comparison.
Table 28
Descriptive Statistics and Paired-Samples t-test Results for Cycle 3 (N = 47 matched pairs)
Dimension | Pre M (SD) | Post M (SD) | t(46) | p | dz [95% CI] | Wilcoxon p |
|---|---|---|---|---|---|---|
IDL | 4.11 (0.68) | 4.20 (0.65) | 1.50 | .141 | 0.22 [−0.08, 0.52] | .134 |
CC | 4.49 (0.51) | 4.29 (0.54) | −3.85 | < .001 | −0.56 [−0.85, −0.27] | < .001 |
DCC | 4.17 (0.60) | 4.26 (0.67) | 1.02 | .315 | 0.15 [−0.15, 0.45] | .344 |
DS | 4.57 (0.53) | 4.53 (0.57) | −0.81 | .420 | −0.12 [−0.42, 0.18] | .405 |
PS | 4.29 (0.71) | 4.36 (0.55) | 0.86 | .397 | 0.12 [−0.16, 0.40] | .439 |
Composite | 4.35 (0.51) | 4.32 (0.52) | −0.61 | .545 | −0.09 [−0.39, 0.21] | — |
Note.dz = Cohen's d for paired designs (Lakens, 2013). Wilcoxon signed-rank tests were computed as sensitivity checks for non-normal difference scores. Full item-level statistics appear in Appendix D.5. 95% CIs for dz were computed as dz ± t(.975, df) × SE (SE = dz/t).
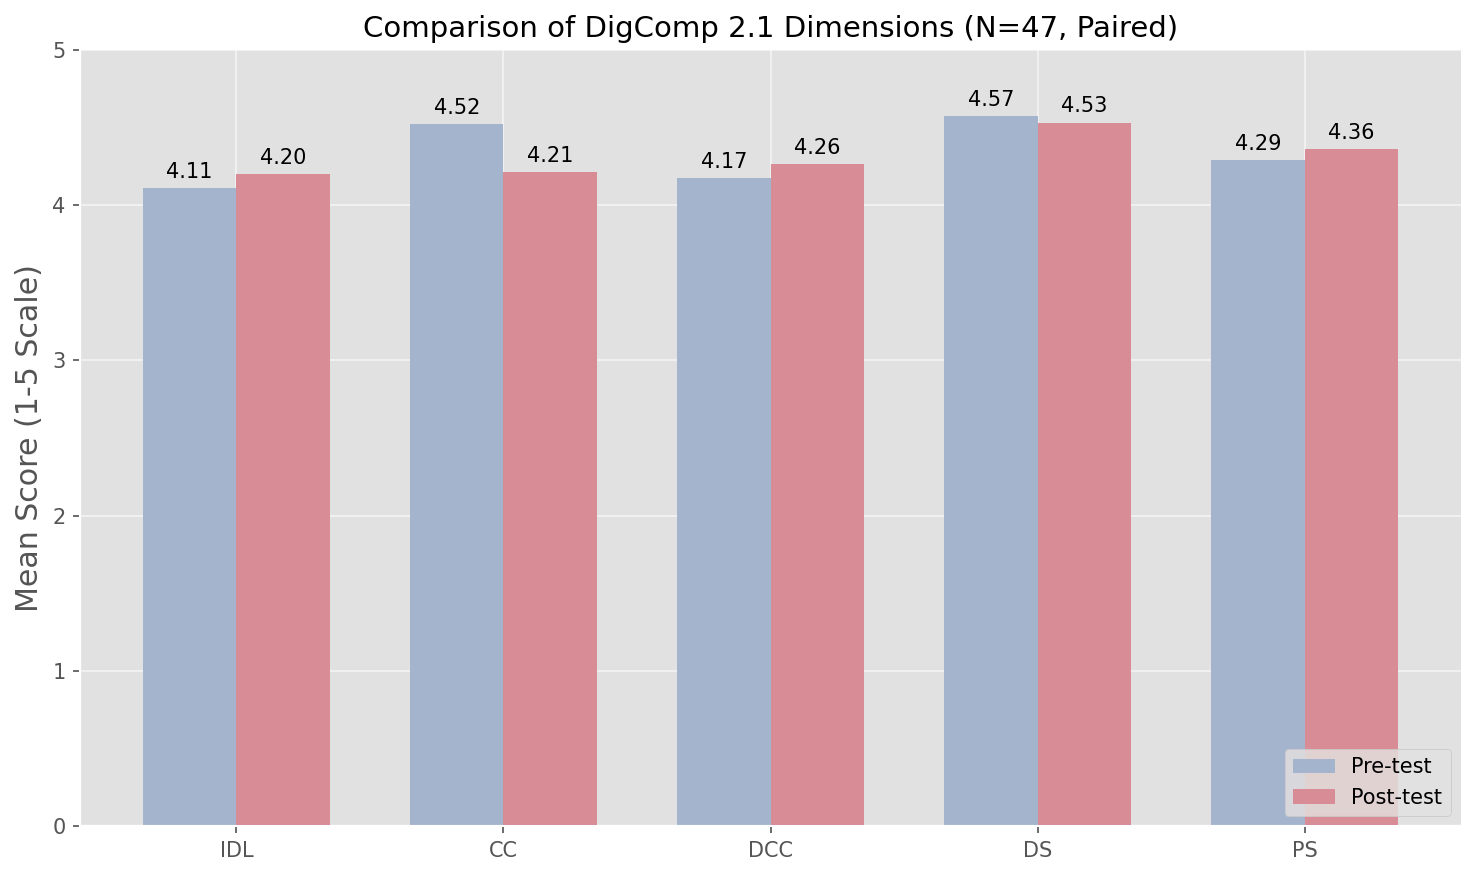
Figure 12
Bar chart showing pre-test vs. post-test scores, with the CC dimension showing a significant decline
The overall pattern is unambiguous: despite, or rather because of, the high baselines (pre-test means from 4.11 to 4.57 on the 5-point scale), no dimension showed a statistically significant gain, and the composite score was unchanged (dz = −0.09, p = .545). This pattern is consistent with the two mechanisms anticipated in Section 6.1. The first is ceiling-limited measurement: with pre-test means already between 4.1 and 4.6 on a 5-point scale, the available upward room was between 0.4 and 0.9 points, so even genuine growth would register as small absolute change (Dimitrov & Rumrill, 2003). The second is the expertise reversal effect (Kalyuga, 2007): the teacher-mediated asset support that freed Cycle 2 students from production burdens removed much of the productive struggle that drives growth in advanced learners, so the scaffolded design added little measurable value for this cohort.
The dimension-level results reward closer inspection, with the exploratory status of Section 3.4.1 in mind. Information and Data Literacy showed a small positive trend (dz = 0.22, p = .141), and the item-level data locate the movement precisely: the search-skill item was unchanged (dz = −0.09). At the exploratory item level, the source-evaluation item improved from 3.98 to 4.21 (dz = 0.35, p = .020, uncorrected). The direction matches Cycle 2's strongest item-level mover (dz = 0.59), but with 13 uncorrected comparisons per cycle, this convergence is read as a hypothesis for future work rather than a confirmed effect. Across three different implementations of the intervention, students' ability to judge and select information sources is the most consistent competence gain, and it is noteworthy that this gain persisted even under ceiling-limited conditions.
Digital Content Creation showed a small, non-significant positive trend (dz = 0.15, p = .315), with both items trending upward (dz = 0.09 and 0.15). These high-achieving students were already comfortable with digital production, and the multimodal task gave them more of it, but the self-report scale registered little new growth at this level. Problem Solving likewise showed a small positive trend (dz = 0.12, p = .397), and the independent-troubleshooting item showed the largest item-level trend of the three PS items (dz = 0.20, p = .181). This trend is consistent with the qualitative evidence of genuine, sustained problem-solving in the lost tourist episode (Section 6.5.2); the small sample and the short scale limit the statistical detection of what the interviews make visible.
Safety showed a small, non-significant decline (dz = −0.12, p = .420): the password item trended downward (dz = −0.19) and the personal-information item was flat (dz = 0.00). The significant Digital Safety decline observed in Cycle 2 therefore did not replicate at full strength in Cycle 3, but it did not reverse either. Whether this reflects the smaller sample, the different population, the informal AI-ethics discussion held in Cycle 3 (which may have re-sensitised students), or a genuine moderation of the Cycle 2 effect cannot be determined from the present data, and it is taken up again in Section 7.6.2.
The Communication and Collaboration dimension showed the only statistically significant change in Cycle 3, and it was a decline (dz = −0.56, p < .001). Because of its size and theoretical importance, it is analysed separately in Section 6.4.2.
Taken together, the quantitative results of Cycle 3 deliver a clear boundary verdict: the scaffolded design that produced measurable gains for mainstream students added no measurable gains for high-achieving learners because the measurement ceiling and the removal of productive struggle worked in the same direction. The value of the intervention for this cohort is visible not in the self-report scales but in the collaborative process itself, to which the qualitative analysis in Section 6.5 turns.
6.4.2 Changes in Self-Assessment within Communication and Collaboration (CC)
The data revealed a counter-intuitive pattern in the Communication and Collaboration dimension. CC scores declined significantly from M = 4.49 (SD = 0.51) to M = 4.29 (SD = 0.54), t(46) = −3.85, p < .001, dz = −0.56, 95% CI [−0.85, −0.27]. Figure 13 displays the inward curve on the group radar chart. As noted in Section 3.4.1, dimension-level results are exploratory.
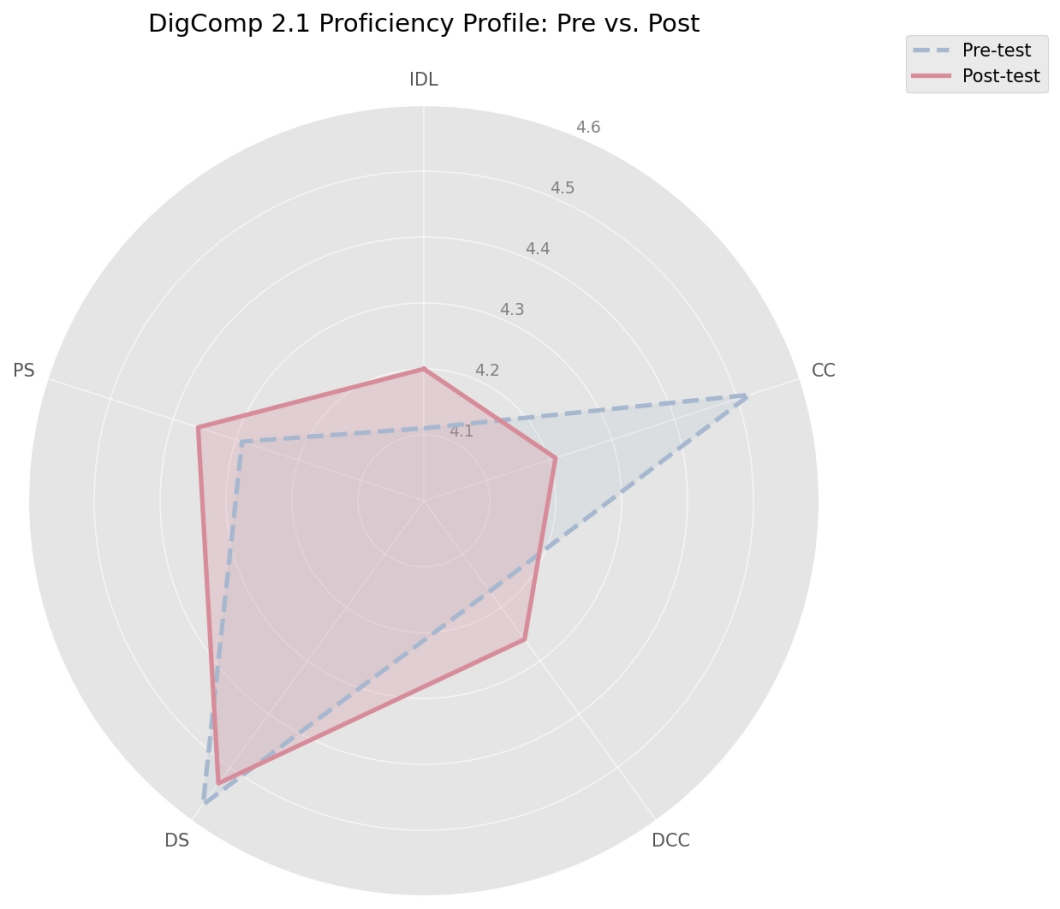
Figure 13
Radar chart showing the inward curve/drop in the CC dimension
Item-level analysis shows that the decline was broad-based rather than driven by a single item. The instant-messaging coordination item fell from 4.57 to 4.19 (dz = −0.57, p = .0003), the cautious-communication item fell from 4.70 to 4.45 (dz = −0.45, p = .004), and the online collaborative work item fell from 4.47 to 4.23 (dz = −0.34, p = .026), while the publishing and sharing item was unchanged (dz = 0.09, p = .537).
This decrease does not necessarily indicate a regression in students' true collaborative skills. A more plausible reading is a recalibration of self-assessment criteria. Before the complex multimodal task, students held a naive conception of teamwork: collaboration meant a mechanical division of labour, with one student writing text and another choosing images. That kind of collaboration is unchallenging, and students rated themselves highly at pre-test. The hub-and-spoke task pulled students out of this comfort zone: they had to integrate diverse assets, negotiate aesthetic standards, and resolve real-time editing conflicts. Through this process, students discovered that collaboration is hard and demanding, and they adopted more mature criteria when assessing their teamwork at post-test. The pattern of lower scores alongside more sophisticated collaborative behaviour (Section 6.5) suggests that the task raised students' standards rather than lowering their abilities.
6.4.3 Alternative Explanations for CC Score Drop
The recalibration account is compelling, but four alternative explanations are also compatible with the data and must be acknowledged before any strong claim.They are: actual competence decline, mood congruence bias, social desirability shift, and regression to the mean. The qualitative evidence argues against the first: negotiation grew more, not less, sophisticated (Section 6.5). The ceiling-high CC baseline (M = 4.49) makes regression to the mean especially plausible. Section 7.5.6 examines all four alternatives systematically. Recalibration remains the best-supported explanation, given the converging evidence: the ceiling-high baseline, the breadth of the item-level decline, and the richer negotiation behaviour documented in Section 6.5. It cannot, however, be confirmed as the sole cause without additional evidence such as retrospective pre-testing or objective behavioural coding of group processes. The CC decline is statistically detectable at the observed level (p < .001), but given the exploratory status of dimension-level results (Section 3.4.1), its meaning remains interpretively underdetermined and should not be oversold as a success.
6.5 Evaluation Phase II: Qualitative Insights The qualitative accounts in this section come from the Cycle 2 focus group transcripts (T1-T3) and the Cycle 3 debriefing field notes, as described in Section 3.4.3.
The qualitative accounts in this section come from the Cycle 2 focus group transcripts (T1-T3) and the Cycle 3 debriefing field notes (Section 3.4.3). This section addresses RQ2 for Cycle 3. To make sense of the mechanisms behind the quantitative pattern, focus group interviews were conducted with six students one week after the project (Section 6.3.4). The thematic analysis reveals a distinct trajectory: students started in confusion, moved through intense negotiation, and arrived at collective fulfilment in their creation. Three episodes capture this progression.
6.5.1 Meeting Team Coordination Challenges: The Chaos of the Multimodal Integration
The interviews confirmed that these high-achieving students overcame low-level operational hurdles quickly. Facing the all-English CLEVR interface, they immediately used browser translation utilities, and students reported in the debriefing that the interface took about 30 minutes to get used to (debriefing field notes).
The multimodal assets triggered a more serious challenge. Because the instructor intentionally offered two complete world-building asset sets (Pearl Kingdom and Gear City), students mixed up files across the two worlds. One group mistakenly used the underwater palace audio in a Gear City scene; another discovered, halfway through construction, that two of its members had built contradictory versions of the same scene from different asset sets. Students reported in the debriefing that contradictory file versions in the shared drive cost them a whole session of sorting (debriefing field notes). These failures were not accidental; they were the mechanism by which the intervention forced real collaboration. In Cycle 2, each student could manage individual assets without coordination, but in Cycle 3 the assets had to be integrated into a single harmonious environment, and coordination became unavoidable. In the debriefing, one student described the moment the group decided to focus on one world: the group reviewed the three-week timeline, categorised the materials, and dropped the more ambitious plan (debriefing field notes). The difficulty of quantity had produced the necessity of governance.
To survive the chaos, the groups set rigid internal rules, including a file-naming convention first introduced by the instructor in Session 3 and voluntarily taken up by all groups by Session 5, plus student-generated enforcement rules such as the milk-tea penalty and majority voting, which the instructor helped codify (Appendix E.3.5; debriefing field notes). The student-generated enforcement rules, and the voluntary uptake of the instructor-introduced convention, mark a shift from superficial cooperation to disciplined team collaboration. Whether they directly improved product quality cannot be determined from the data; they may reflect genuine organisational improvement or rituals with limited practical effect. They are reported here as indicators of changed group norms, not as proven quality-improving instruments.
6.5.2 The Lost Tourist: From Navigation Failure to User Empathy
The most pedagogically consequential episode of Cycle 3 happened during the spatial integration stage. Designing navigation hotspots between scenes proved unexpectedly challenging. Groups built links from the central hub to the sub-scenes without problems, but they did not design the paths back. During VR testing, a catastrophic user experience failure unfolded: once a visitor jumped from the main scene to a sub-scene, they could not return.
The failure unfolded progressively. In Session 5, groups successfully created the forward links, and everything looked fine from the builder's point of view. In Session 6, groups started testing with the VR headset, and the first testers discovered the problem when they could not find a way back (instructor observation and debriefing field notes). The group initially dismissed the concern, assuming the tester had overlooked an obvious control. Three other students tested the same navigation path, and all four got lost.
This was a fundamental design error that rendered the entire environment unusable: the groups had designed for arrival, not for departure. The instructor observed the same failure across groups and reframed it instead of offering a technical solution, introducing the notion of the "lost tourist", a user who enters a virtual world without knowing how to exit. The reframing served two purposes: it recast a technical problem as a design issue with human consequences, and it invited students to use their own experience of being lost as a resource for empathic design. One student later described the emotional shift: hearing "lost tourist" made him picture himself as that tourist, and he did not want anyone else to feel that way in something he built (debriefing field notes).
The empathic reframing generated sustained collective engagement. The group searched collaboratively for solutions, trying different parameter configurations and repeatedly undoing and reworking the navigation paths, a search that students later described as trying to see the world through a lost tourist's eyes (debriefing field notes). In the debriefing, students described trying several approaches before settling on a version that looked good and worked (debriefing field notes). This persistence is notable because the same students had abandoned less consequential aesthetic problems in earlier sessions.
What distinguished this episode from ordinary troubleshooting was the emotional investment: students were safeguarding a potential visitor from an unsatisfying experience, not merely fixing a bug. Nobody complained about the rework despite the deadline. Instead, the group voluntarily added features beyond the assignment requirements: hover sound effects for clickable areas, a visual progress bar showing the visitor's location, and welcome screens orienting visitors to the navigation structure. These features came from a new criterion the students had adopted: would a lost tourist feel safe in our world?
The episode also changed how the group handled every later decision. Instead of arguing about whose aesthetic taste should dominate, members asked what a visitor would need (debriefing field notes). This is a reorientation from creator-centred to user-centred design, a significant developmental milestone in digital competence. When the repaired navigation worked flawlessly in the final test, students described the repaired environment as exhilarating (debriefing field notes).
The episode shows how an implementation challenge, when reframed as a design problem with human consequences,can build user empathy, iterative reasoning, and cooperative resilience.
6.5.3 Breaking Through: External Validation and Collective Fulfilment
The joint effort culminated when students shared their works outside the classroom, and external validation crystallised their achievement. One student shared a concluding reflection in the debriefing: after showing the finished world to his mother, her astonished reaction made the weeks of argument and rework feel worthwhile (debriefing field notes).
This moment served a pedagogical purpose beyond personal satisfaction. The mother's response was evidence of a working spatial narrative: an immersive experience that could convey narrative intention to a non-technical audience. For students who had spent weeks struggling with file management, aesthetic disagreements, and navigation, this validation settled the value of the struggle. Other students reported similar experiences. Another student reported demonstrating the environment to his younger sibling, who found the entrance unaided, evidence to the student that the navigation worked for a non-technical user (debriefing field notes). Another student described showing the environment to a classmate from a non-science track, who wished her class could do the same and could not tell the result was student-made (debriefing field notes).
The instructor noted that these external validation experiences consolidated the identity shift that began with the lost tourist episode. Students who had described themselves as task-compliers came to describe themselves as experience-designers. This shift in self-conception is not quantified, but it is an important constructionist outcome: students began to see their work as having genuine audience value rather than merely meeting assignment requirements.
The qualitative insights converge on three themes: coordination chaos, user empathy, and external validation. Section 6.6 considers how these themes contribute to the cross-cycle design principles.
6.6 Summary of Cycle 3, and Contribution to Design Principles
6.6.1 Chapter Summary
This final design cycle steered high-achieving students through a complex multimodal VR creation task, pushing them beyond mechanical task division by requiring asset integration that made superficial cooperation infeasible. The quantitative results showed no significant gains on any dimension, a pattern consistent with ceiling-limited measurement and the expertise reversal effect: the scaffolded design that helped mainstream students added little measurable value for advanced learners. The only nominally significant positive result at the item level was the source-evaluation item (dz = 0.35, p = .020), which does not survive FDR correction and is reported as a hypothesis consistent with Cycle 2's pattern. The counter-intuitive decline in Communication and Collaboration self-assessment (dz = −0.56, p < .001), considered together with qualitative evidence of richer negotiation and mutual accountability, suggests a recalibration of collaboration standards rather than a loss of competence. The focus group interviews traced a trajectory from initial chaos through sustained negotiation to collective fulfilment, held together by the lost tourist episode that transformed navigation failure into user empathy.
Cycle 3 completes the three-cycle DBR trajectory. Together, the three cycles produce four convergent findings: (1) reduce technical barriers before introducing cognitive challenge; (2) scaffold genuine collaboration through structurally interdependent tasks; (3) calibrate AIGC assistance to preserve problem-solving demand; (4) use dominant challenges as a pedagogical pivot, not an obstacle.
Chapter 7 synthesises these findings into actionable design principles, addresses limitations, and considers policy implications.
6.6.2 Specific Contributions to Cross-Cycle Design Principles
Contribution to Principle 1 (reduce technical barriers before introducing cognitive challenge). Cycle 3 confirmed that barrier reduction is essential even for high-achieving students: the 30-minute interface adaptation period consumed productive collaboration time. Cycle 3 also qualifies the principle: for advanced learners, barrier reduction must be tuned so that it removes frictional obstacles without eliminating productive struggle. The teacher-mediated asset support that worked well in Cycle 2 stripped away precisely the kind of challenge these students needed, which helps explain the absence of measurable gains.
Contribution to Principle 2(scaffold genuine collaboration through structurally interdependent tasks). Cycle 3 provides the strongest evidence for this principle. The multimodal integration requirement acted as a structural scaffold that made genuine interdependence unavoidable: students could not finish the task without negotiating aesthetic standards, coordinating file management, and resolving conflicting creative visions. Student-generated penalty systems and democratic decision procedures, alongside voluntary adoption of the instructor-introduced naming convention, show that when task structure forces cooperation, students develop organisational practices that outlast the specific intervention.
Contribution to Principle 3 (calibrate AIGC assistance to preserve problem-solving demand). Cycle 3 tested this principle at the upper bound of student ability. The lost tourist episode shows that moderate friction, in the form of a navigation failure with real user consequences, preserved productive struggle without overwhelming students. The emotional stakes of the failure made the problem meaningful rather than a random bug, which suggests that calibration should consider not only cognitive load but also the affective significance of the problems students face.
Contribution to Principle 4 (use a dominant challenge as a pedagogical pivot, not an obstacle). Cycle 3 confirmed this principle directly. Instead of solving the navigation failure for the students, the instructor reframed it through the lost tourist concept, transforming a technical bug into a human-centred design lesson. The result was user empathy, sustained rework, and the realisation that a technical system has human consequences. Dominant challenges should not be eliminated at first sight; they should be re-conceptualised as the kind of learning that only genuine difficulty can produce.
Cycle 3 also produced a cross-cutting observation that informs all four principles. The core competence developed through collaborative VR creation is not tool operation but systemic integration, spatial reasoning, and negotiation with others. The Cycle 2 cohort, which had mastered the CLEVR platform by the end of its cycle, did not show higher competence simply from using the tools more. The Cycle 3 cohort started with no platform experience, and its students developed further only when the multimodal task confronted them with integration challenges. This observation supports the conceptual argument of Chapter 7: the educational value of immersive creation lies not in the technology itself but in the collaborative reasoning that the technology makes necessary.
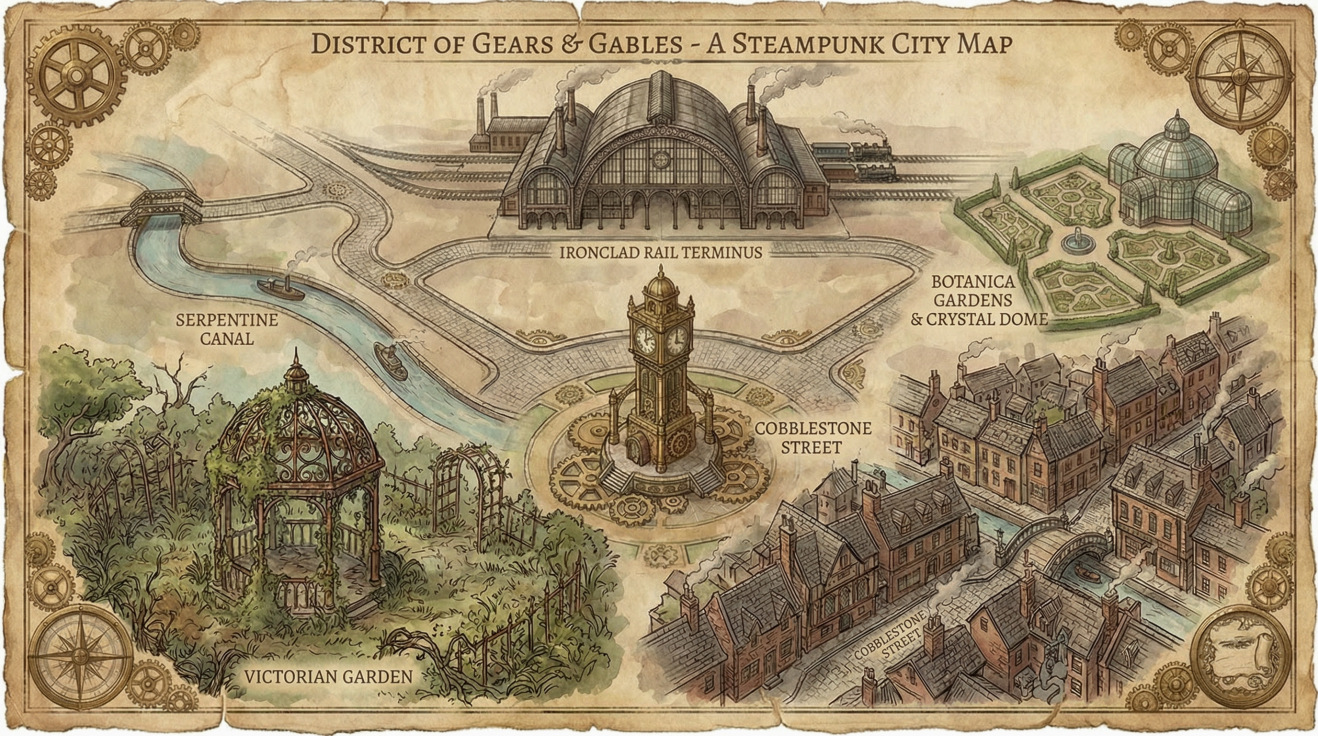
Figure 14
Drafted Story Map showing the "1 centre, 5 radiating" spatial logic
Chapter 7: General Discussion and Design Principles
Chapters 4 through 6 traced a three-cycle Design-Based Research trajectory. Cycle 1 established the baseline: collaborative VR creation developed digital competence in three dimensions, but manual asset production imposed prohibitive technical barriers that blocked higher-order learning. Cycle 2 showed that teacher-mediated AIGC asset production removed these barriers and produced significant gains in Information and Data Literacy and Digital Content Creation, together with a modest composite gain, while exposing new problems: collaboration remained superficial, Problem Solving showed no growth, and Digital Safety declined. Cycle 3 tested the boundary condition with a high-achieving science-track subsample and found that the scaffolded design added no measurable gains for advanced learners, while their Communication and Collaboration self-assessment declined significantly, a pattern best explained as a recalibration of collaboration standards rather than a loss of competence. Taken together, these cycles yield a differentiated verdict: when technical barriers are managed through calibrated scaffolding, collaborative VR creation becomes a practical means of building K-12 students' digital competence, but its effects depend on how the scaffolding is tuned to the task and the learner. This chapter synthesises these cross-cycle findings into four actionable design principles and one provisional guideline, addresses limitations, and outlines policy implications and future research directions.
7.1Cross-Cycle Synthesis and Theoretical Framing
The trajectory from implementation barriers to student engagement presented here is a developmental narrative of an iterative design process, not a pre-registered hypothesis test. The DBR cycles were problem-driven rather than theory-driven: each cycle addressed the practical problems identified in the preceding iteration, and the analytical framework emerged through retrospective analysis. The principles proposed in this chapter are empirically informed heuristics, not experimentally validated causal laws, and cross-cycle comparisons should be read as illustrative of a developmental trajectory rather than as evidence of a predetermined sequence.
7.1.1 Cross-Cycle Patterns: From Challenges to Design Principles
The cross-cycle analysis reveals systematic patterns in how students responded to the evolving intervention design. Each cycle introduced different implementation challenges, and the research team adjusted the design accordingly (Table 29). Cycle 1 was dominated by technical barriers: students struggled with device management, manual file uploads, and software navigation, and these barriers consumed the attention needed for creative planning and collaboration. The Cycle 2 redesign addressed these issues through teacher-mediated asset production and a streamlined workflow. Technical barriers receded, but communication challenges emerged: students had difficulty composing effective prompts and coordinating their creative visions. Cycle 3 added multimodal complexity, which intensified team coordination demands: students had to manage multiple media types, negotiate creative decisions, and sustain engagement across a longer production timeline.
This trajectory shows a clear progression: as one category of challenge diminished, another became salient. The intervention did not eliminate difficulty; it shifted the locus of difficulty from technical operations to collaborative judgement. This displacement reflects the deliberate design strategy of reducing unnecessary complexity while preserving the problem-solving demands that drive competence development. The four design principles articulated in Sections 7.2 through 7.5 generalise from this pattern. They are offered as empirically grounded heuristics from a specific context, Chinese Grade 7 students in a technology-enhanced STEM programme, and their transferability to other settings has yet to be tested.
7.1.2 Cross-Cycle Empirical Trajectory
Table 29 compares the three DBR cycles across six dimensions. Cycle 2 includes platform interaction logs that provide behavioural evidence of student actions; Cycle 3 does not, and relies primarily on pre-post assessment data and focus group interviews because the hub-and-spoke classroom organisation meant that platform logs captured mainly the single operator's actions and were therefore unsuitable for collaboration analysis. Cross-cycle comparisons involving Cycle 3 thus rest on different evidentiary foundations from those involving Cycles 1 and 2.
Table 29
Cross-Cycle Synthesis of the DBR Evolution
Dimension | Cycle 1: The Baseline | Cycle 2: The AIGC Introduction | Cycle 3: The Multimodal Matrix |
|---|---|---|---|
Pedagogical Task | Manual panoramic capture and platform assembly | Single-line digital asset generation (text-to-image) | Complex multimodal VR storytelling (Hub and Spoke spatial logic) |
Tool Integration | Around Capture (smartphone app) and 720yun | Basic AIGC tools (text-to-image) + standard VR platform | CLEVR concurrent platform + Kimi + Jimeng |
Primary Challenge | Technical barriers (team coordination challenges also present) | Communication challenges (team coordination challenges co-emerged; technical barriers residual) | Team coordination challenges (technical and communication challenges persisted at lower levels) |
Collaborative Dynamics | Unequal participation: one student controls the mouse, others watch | Superficial division of labour ("I do text, you do image") | Collaborative knowledge building with strict internal rules (e.g., naming conventions) |
Student Outcome | High extraneous cognitive load; severe frustration; low motivation | AIGC-assisted content creation with stagnant problem-solving | CC self-assessment decline (interpretation unresolved; see Section 7.5.6); high-achieving sample |
The trajectory shows how the dominant challenge type shifted across cycles, from technical operations in Cycle 1, to communication difficulties in Cycle 2, to team coordination demands in Cycle 3. Each cycle reduced unnecessary complexity in one area while preserving or introducing productive challenge in another. In Cycle 2, the removal of mechanical barriers allowed students to focus on content work, but Problem Solving showed no measurable growth (dz = 0.01) because the ease of asset generation removed the troubleshooting situations in which problem-solving develops. In Cycle 3, the intentional elevation of task complexity made coordination challenges educationally productive: students developed self-organised governance structures, established communication norms, and demonstrated sustained collaborative negotiation across the production timeline, even though these advances did not register as gains on the self-report scales. This pattern suggests that effective scaffolded learning does not eliminate difficulty but shifts it towards domains where students can exercise higher-order judgement and collaborative skills.
7.1.3 The CC Score Decline: A Plausible but Unverified Interpretation
A notable finding from Cycle 3 was the statistically significant decline in Communication and Collaboration self-assessment scores (dz = −0.56, p < .001), despite qualitative evidence of richer collaborative practices. One plausible interpretation is that students recalibrated their self-assessment standards between pre-test and post-test: when participants gain a more sophisticated understanding of what a competence domain actually involves, they may judge their own performance more harshly against a more demanding internal criterion (Sprangers & Schwartz, 1999). The qualitative evidence from Cycle 3 supports this view: students described their collaboration as more rigorous after experiencing the multimodal matrix's demands, and they adopted and helped shape stricter internal governance conventions, such as file-naming rules and "milk tea penalties" for disorganised behaviour, that signal an elevated conception of what good collaboration entails. The matched comparison in Section 6.1.3 adds quantitative support: the CC decline in Cycle 3 was larger than that of Cycle 2 students matched on pre-test score and gender, which is consistent with a contribution of task complexity beyond population differences, though not decisive (p = .059).
This interpretation is unverified rather than confirmed. The study did not employ a then-test design, the standard methodological approach for verifying recalibration, in which participants re-rate their pre-test competence retrospectively at post-test (Howard & Dailey, 1979). Without this verification, the decline could reflect any of several alternative processes, examined systematically in Section 7.5.6. The most parsimonious competing interpretation is regression to the mean: the CC baseline was the highest of the five dimensions (M = 4.49), close to the instrument ceiling, so statistical room for downward movement was maximal. Another possibility is that the more demanding multimodal task exposed genuine gaps in collaborative competence that the easier Cycle 2 task had masked. The epistemically appropriate stance is therefore conditional: the recalibration interpretation is consistent with the qualitative evidence and compatible with the quantitative pattern, but it is not confirmed by the available data. Future research employing then-test methodology or objective behavioural measures of collaborative quality would be required to test it more rigorously.
7.2 Design Principle 1: Reduce Technical Barriers before Introducing Cognitive Challenge
7.2.1 Principle Statement
This principle was derived from a design-based research study conducted in well-resourced Chinese middle schools with strong AI infrastructure, employing a single-group pre-test-post-test design without a control condition; it should be treated as an empirically grounded heuristic rather than a validated causal law.
Technical barriers must be reduced before students can engage with higher-order collaborative and creative tasks. When students are occupied with navigating unfamiliar interfaces, managing hardware malfunctions, or executing basic file operations, their cognitive resources are consumed by operational concerns rather than being available for design reasoning, aesthetic judgement, or collaborative negotiation. Pedagogical designs that introduce cognitively demanding tasks without first ensuring technical fluency risk producing frustration rather than learning.
7.2.2 Cross-Cycle Evidence
The evidence for this principle appeared consistently across all three cycles. In Cycle 1, students encountered substantial technical barriers when operating the capture app and navigating basic VR editing platforms. Hardware failures were common, menu structures were unintuitive, and students with lower baseline digital literacy were effectively excluded from meaningful participation: one student controlled the input device while others became passive observers, a pattern of unequal participation driven not by pedagogical choice but by technical barriers that made distributed participation impractical. The resulting extraneous cognitive load blocked creative engagement entirely (Section 4.5).
Cycle 2 showed how reducing technical barriers through teacher-mediated AIGC tools shifted student activity from operational struggle to content-focused work: when students could obtain digital assets without manual production, Information and Data Literacy and Digital Content Creation improved significantly, and the composite score showed a modest gain(Section 5.2). This evidence also revealed a boundary condition: barrier reduction alone does not guarantee higher-order competence, as the flat Problem Solving outcome in Cycle 2 illustrates.
Cycle 3 confirmed the principle from the opposite direction. The Cycle 3 students were new to the CLEVR platform, and even these high-achieving students needed about 30 minutes of interface adaptation before productive collaboration was possible (Section 6.5.1). Baseline technical fluency remains a precondition for meaningful engagement with collaborative complexity, even for advanced learners. At the same time, Cycle 3 qualifies the principle: because the scaffolded design removed most production friction, these advanced learners showed no measurable competence gains, which suggests that barrier reduction for high-ability students must be tuned to preserve productive struggle (Section 6.6.2).
7.2.3 Implementation Conditions
This principle assumes three implementation conditions. First, students must possess baseline digital literacy sufficient to operate standard software interfaces; where this baseline is absent, preliminary technical training is required. Second, new tools must be introduced gradually, with structured scaffolding that isolates interface learning from task complexity. Third, instructors must monitor frustration levels actively and adjust pacing when technical barriers threaten to overwhelm cognitive capacity for creative engagement.
7.2.4 Operational Steps
1.Assess baseline technical skills before introducing complex tasks.
2.Select tools with low learning curves for initial stages.
3.Provide structured tutorials focused on interface fluency rather than task completion.
4.Monitor frustration levels through observation and brief check-ins.
5.Introduce collaborative complexity only after students show technical fluency with core tools.
7.2.5 Evidence Strength
Evidence Strength: Moderate to strong, from a single-site DBR; replication pending. This principle appeared across all three cycles with consistent results. Cycle 1 showed the negative consequences of unresolved technical barriers, Cycle 2 showed how their removal enabled a shift to content creation, and Cycle 3 confirmed that baseline technical fluency is a precondition for engaging with collaborative complexity, even for high-achieving students. The pattern is robust within the parameters of this study; replication in other schools and samples is pending.
7.2.6 Counter-Arguments and Alternative Explanations
Principal Counter-Argument.The strongest challenge to this principle comes from the "desirable difficulties" literature in cognitive psychology. Bjork and Bjork (2011) argue that some degree of extraneous challenge can improve long-term retention and transfer by forcing learners to engage in deeper processing during encoding. From this perspective, eliminating technical barriers too thoroughly might produce short-term fluency at the expense of durable competence: if students never struggle with interface mechanics, they may fail to develop the troubleshooting skills and error-recovery strategies that underpin genuine digital competence.
Rebuttal. The evidence from this study does not support preserving technical barriers as a desirable difficulty. The distinction between productive challenge and overwhelming extraneous load lies in whether the difficulty targets germane processing or extraneous processing. Technical barriers, as operationalised in this study, consist almost entirely of extraneous load: interface navigation, hardware troubleshooting, and file-management operations that consume working memory without contributing to the target competences of digital content creation, collaborative reasoning, or design thinking. The desirable difficulties that Bjork and Bjork (2011) identify, such as spacing, interleaving, and retrieval practice, target core cognitive processes of schema construction, not peripheral mechanical operations. The rebuttal thus rests on the distinction between extraneous and germane load: reducing technical barriers offloads the former while preserving capacity for the latter. Cycle 3 adds a qualification to this rebuttal: for learners who have already automated basic schemas, further reduction is no longer productive, which is why the principle includes a tuning clause for high-ability students.
Boundary Conditions.This principle should not be interpreted as advocating the elimination of all technical challenge. Three boundary conditions constrain its generalisability. First, the principle applies primarily to novice learners who have not yet automated basic interface schemas; for expert users, some interface complexity may be educationally productive if it aligns with professional-grade tools they will encounter. Second, the principle assumes that the technical operations being offloaded are peripheral to the target competence; if technical skill itself is the learning objective, as in a programming or hardware course, friction reduction would undermine rather than support learning. Third, the principle was validated in well-resourced Chinese middle schools with strong technical infrastructure; in under-resourced settings where technical failures are systemic rather than incidental, the principle may require adaptation to address infrastructure gaps before individual-level scaffolding can be effective.
7.3 Design Principle 2: Scaffold Collaboration, Not Just Coexistence
7.3.1 Principle Statement
Task design must require genuine negotiation and shared decision-making, not merely parallel individual work. When students are assigned tasks that can be decomposed into independent sub-tasks and recombined at the end, they may coexist in the same workspace without ever engaging in the substantive communication, compromise, and joint reasoning that characterise authentic collaboration. Pedagogical designs must create structural interdependence that makes individual contributions contingent on group coordination.
7.3.2 Cross-Cycle Evidence
Cycle 2 provided clear evidence of the coexistence problem. Students adopted a superficial divide-and-conquer approach: one student generated text prompts, another selected images, and a third assembled components. Because the task did not require real-time negotiation or aesthetic consensus, students worked in parallel silos, and their self-reported Communication and Collaboration scores showed no significant change (dz = 0.14, p = .107). The task design permitted coexistence without demanding collaboration (Sections 5.2 and 5.4).
Cycle 3, by contrast, created conditions that forced genuine negotiation. The multimodal matrix required students to integrate six panoramas, background music, voiceovers, and explanatory texts into a single coherent spatial narrative. Under the hub-and-spoke setup, one student operated the computer while peers discussed and directed, so every proposed change had to be argued for before it happened. Conflicts were immediate and visible: assets were accidentally deleted, files from different cultural themes were mixed, and aesthetic disagreements emerged spontaneously. This chaos was educationally productive precisely because it made collaboration unavoidable (Section 6.5.1).
The student self-organisation observed in Cycle 3, the creation of strict file-naming conventions and the informal enforcement of penalties for disorganised behaviour, should not be interpreted as a prescription for instructor-imposed rules. Rather, it is evidence that students are capable of self-organising when task conditions create sufficient collaborative demand. The "milk tea penalty" and naming conventions emerged organically from group necessity, indicating that the task structure was the primary driver of collaborative maturation, although the instructor helped codify the conventions the groups had started (Appendix E.3.5).
7.3.3 Implementation Conditions
Interdependence works only when three conditions hold. First, tasks must have interdependent components such that individual contributions cannot be evaluated independently of the whole. Second, individual contributions must be visible and accountable to the group, preventing free-riding and encouraging mutual monitoring. Third, group size should allow direct synchronous communication; groups of three to six students appear workable for this type of negotiation, although the present study cannot isolate the effect of group size.
7.3.4 Operational Steps
1.Design tasks with shared deliverables that require integration across all members.
2.Require aesthetic or narrative consensus before finalising any component.
3.Use concurrent platforms that prevent siloed work by making all edits visible in real time.
4.Monitor for superficial cooperation through observation of group process and individual contributions.
5.Introduce complexity incrementally, beginning with paired tasks before expanding to larger group structures.
7.3.5 Evidence Strength
Evidence Strength: Moderate to strong for the principle's core claim, with one qualification.The coexistence problem in Cycle 2 is documented by both self-report data (no significant CC gain) and qualitative observations of parallel, siloed work. The effectiveness of structural interdependence in Cycle 3 is documented qualitatively: forced integration produced negotiation, self-organised governance, and sustained collaborative behaviour that students themselves described as more rigorous than their earlier teamwork. The qualification concerns measurement: these richer collaborative behaviours did not produce higher CC self-assessment scores, which declined significantly in Cycle 3. The principle therefore holds for the quality of collaborative process, but this study's self-report instrument does not capture that quality directly, and objective behavioural measures of collaboration depth remain a task for future research.
7.3.6 Counter-Arguments and Alternative Explanations
Principal Counter-Argument.The strongest challenge to this principle comes from the individual differences literature on collaboration. Not all students benefit equally from highly interdependent group work; introverted learners, students with social anxiety, and those who prefer structured individual tasks may experience forced collaboration as a source of additional extraneous load rather than as a productive challenge (Barron, 2003; Rogat & Linnenbrink-Garcia, 2011). From this perspective, mandating structural interdependence risks privileging extroverted, verbally fluent students while marginalising those whose strengths lie in independent, reflective work. The "milk tea penalty" observed in Cycle 3, while charming as an indicator of emergent group norms, could also be interpreted as peer pressure that suppresses individual dissent.
Rebuttal.The evidence from this study supports the principle within the boundary conditions specified, while acknowledging that those boundaries exclude some learner profiles. The rebuttal rests on two lines of evidence. First, the qualitative data from Cycle 3 showed that even students who described themselves as initially uncomfortable with group work reported positive outcomes after the task concluded, suggesting that the alignment between task demands and student capabilities shifted during activity rather than remaining static. Second, the principle does not advocate unstructured group work; it specifically calls for scaffolded collaboration with clear task structures, defined roles, and visible accountability mechanisms, conditions that reduce the social ambiguity that typically produces anxiety in collaborative settings. In Cycle 3 the shared screen served this function. Because one student operated the computer under peer direction, every action was visible to the whole group, which may have mitigated the free-rider anxiety documented in less structured collaborative contexts.
Boundary Conditions.The reach of this principle is limited in three ways. First, the workable range of three to six students was observed in a specific cultural and institutional context and remains a hypothesis (Chinese middle schools with collectivist educational norms); individualist educational cultures may require different group-size parameters or additional ice-breaking protocols. Second, the principle assumes that students possess baseline communication skills in the language of instruction; multilingual classrooms or classrooms with students who have communication difficulties may require modified task structures that allow for alternative modes of contribution, such as visual planning boards or non-verbal feedback systems. Third, the principle was validated with synchronous, co-located collaboration; its applicability to asynchronous or remote collaborative VR creation is untested and may require additional scaffolding for temporal coordination.
7.4 Design Principle 3: Calibrate AI GC Assistance to Preserve Problem-Solving Demand
7.4.1 Principle Statement
Teacher-mediated AIGC tools should reduce technical barriers without eliminating the cognitive challenge of design decisions, creative choices, and spatial reasoning. When AI assistance is calibrated appropriately, it functions as a scaffold that enables students to engage with problems that would otherwise exceed their current capacity. When it is miscalibrated, generating complete solutions rather than raw materials, it risks producing an illusion of competence while allowing underlying cognitive skills to atrophy.
7.4.2 Cross-Cycle Evidence
Cycle 2 illustrated the risks of poorly calibrated AI assistance. Students used text-to-image tools to obtain digital assets with minimal effort, producing impressive visual outputs that obscured the absence of deeper cognitive engagement. Problem Solving showed no measurable growth (dz = 0.01, p = .903): students could select images but demonstrated limited independent problem formulation, and their own accounts describe a workflow in which AI supplied ready-made assets and removed the need for problem formulation (Section 5.2.1). The ease of generation created an illusion of competence, the appearance of creative productivity without the corresponding development of generative problem-solving capabilities.
Cycle 3 resolved this tension by increasing task complexity in ways that restored problem-solving demand. The multimodal matrix required students to make spatial design decisions (hub-and-spoke architecture), negotiate aesthetic coherence across multiple media types, and resolve navigational logic. Teacher-mediated AIGC tools still generated raw materials (panoramas, music, voiceovers), but the cognitive challenge shifted to integration, sequencing, and user experience design. Students were no longer merely consuming AI-produced content; they were acting as experience designers who curated, composed, and tested integrated multimodal environments. The lost tourist episode (Section 6.5.2) shows the kind of genuine, sustained problem-solving that this restored demand produced.
This evidence reveals a productive tension: teacher-mediated production makes content generation easy but makes integration harder. The very abundance of generated material created new challenges (file management, aesthetic consistency, spatial logic) that demanded higher-order reasoning. Calibrated appropriately, AIGC did not replace student cognition; it displaced it towards design decisions that were previously inaccessible because of mechanical constraints.
7.4.3 Implementation Conditions
Calibration succeeds under three conditions. First, teacher-mediated assets should be restricted to generating raw materials rather than complete products, ensuring that students must still make curatorial and compositional decisions. Second, students must be required to make manual integration, spatial design, and navigational choices that cannot be automated through prompting. Third, instructors must assess process, including design rationale, revision history, and decision documentation, rather than evaluating output quantity alone.
7.4.4 Operational Steps
1.Limit AIGC to asset generation, prohibiting its use for structural or navigational design.
2.Require manual integration, spatial layout, and user pathway design.
3.Assess design rationale through written or oral justification of creative choices.
4.Monitor for over-reliance on AI through observation of prompting behaviour and revision patterns.
5.Gradually reduce AI scaffolding across instructional sequences to promote independent problem-solving.
7.4.5 Evidence Strength
Evidence Strength: Moderate to strong.The risk of skill atrophy under insufficiently constrained AIGC assistance is documented directly: Problem Solving showed no growth in Cycle 2 (dz = 0.01), and focus group accounts attribute this to selection replacing generation. The effectiveness of restoring demand is documented qualitatively in Cycle 3, where increased task complexity produced sustained, genuine problem-solving (the lost tourist episode), although the high-achieving sample showed no measurable quantitative gains and may not represent broader populations. The principle is theoretically sound and empirically supported within this study's parameters; further research is needed to establish boundary conditions for different learner profiles.
7.4.6 Counter-Arguments and Alternative Explanations
Principal Counter-Argument.The strongest challenge to this principle arises from the expertise reversal literature. Kalyuga (2007) demonstrated that instructional guidance that benefits novices can become redundant or counterproductive for more knowledgeable learners. In the context of AIGC calibration, this implies that the raw-materials-only restriction may be appropriate for novices but excessively constraining for students who have already developed curatorial competence. Furthermore, the rapid evolution of AIGC tools means that the boundary between raw-material generation and complete-solution generation is increasingly blurred: modern multimodal AI systems can already generate coherent spatial narratives, suggesting that the principle's operationalisation may become technically obsolete within short timeframes.
Rebuttal.The rebuttal draws on the principle's explicit boundary conditions. The principle is calibrated for K-12 novice learners in schools, not for advanced students or professional designers. Within this population, the Cycle 2 evidence is direct: when AI generated complete visual assets without requiring students to make integration or compositional decisions, problem-solving competence stagnated. The expertise reversal effect would predict that the same students, after developing automated schemas for VR integration, might benefit from reduced scaffolding, a prediction that aligns with the principle's call for gradually reducing AI scaffolding across instructional sequences (Operational Step 5). The principle is therefore not static but developmental, anticipating the very expertise reversal that the counter-argument raises.
Regarding the technological obsolescence concern, the rebuttal distinguishes between specific tool capabilities and enduring instructional logic. Even if AIGC systems eventually generate complete VR environments, the instructional decision of whether to permit students to use that capability remains a pedagogical choice. The principle's core insight, that cognitive challenge must be preserved in the integration and design layers even when generation is automated, is independent of any particular platform's current capabilities.
Boundary Conditions.Three boundary conditions apply. First, the principle assumes that the target competence includes design reasoning and compositional judgement; in contexts where the learning objective is prompt engineering or AI tool fluency itself, the calibration logic would invert. Second, the principle was validated with text-to-image and text-to-music tools; its applicability to more advanced generative systems, such as end-to-end VR scene generators, has not been tested. Third, the principle assumes instructor capacity to monitor AI over-reliance, which may not hold in large classes or in settings where teachers themselves lack familiarity with AIGC capabilities.
7.5Design Principle 4: Use Dominant Challenges as a Pedagogical Pivot, Not an Obstacle
7.5.1 Principle Statement
Technical and collaborative failures should be treated as designed learning moments rather than as problems to eliminate entirely. When failures are anticipated, framed, and redirected through instructor facilitation, they can trigger shifts in student perspective, from task completion to user-centred design thinking, that would be difficult to achieve through direct instruction alone.
7.5.2 Cross-Cycle Evidence
Evidence for this principle appeared in all three cycles. In Cycle 1, the chain of technical failures documented in the failure cases (Section 4.5) became the direct evidence base for the Cycle 2 redesign, showing how a dominant challenge, once analysed rather than suppressed, can redirect an entire intervention design. In Cycle 2, the 18,652-event anomaly in Group S01, initially read as misbehaviour, was reframed through post-hoc investigation as evidence of a platform design vulnerability, which then informed the platform requirements for Cycle 3 (Section 5.3.5). The strongest evidence comes from Cycle 3 and the lost tourist episode (Section 6.5.2). Multiple groups failed to design return pathways for their navigation hotspots, so that users testing the environments became trapped in sub-scenes with no way back. Instructor facilitation redirected this frustration into empathy-driven redesign: the prompt of the "lost tourist" shifted students' perspective from self-focused frustration to user-focused concern. The subsequent redesign of return pathways was not merely a technical fix but a conceptual shift: students began thinking of their VR environments as user experiences rather than as collections of impressive assets. This episode is documented through student self-reports and instructor observations, not through platform log data, which Cycle 3 did not collect in analysable form.
7.5.3 Implementation Conditions
This principle requires three conditions. First, failures must be recoverable within the available time and resources; severe failures that undermine student confidence are counterproductive. Second, instructors must have prepared prompts ready to redirect frustration into empathy or design reasoning. Third, the schedule must contain a time buffer that allows for meaningful redesign without compromising task completion.
7.5.4 Operational Steps
1.Anticipate likely failure points during task design and prepare corresponding facilitation strategies.
2.Prepare empathy-triggering prompts that shift student perspective from self-focused frustration to user-focused design thinking.
3.Build time for redesign into the instructional schedule.
4.Frame failures explicitly as user-testing data rather than as personal mistakes.
5.Celebrate redesign achievements explicitly to reinforce the value of iterative improvement.
7.5.5 Evidence Strength
Evidence Strength: Moderate. The principle appeared in all three cycles, with the Cycle 1 failure analysis driving the Cycle 2 redesign and the Cycle 2 anomaly driving platform requirements. The Cycle 3 evidence for the empathy pivot is entirely qualitative, based on debriefing accounts from six purposively selected students plus instructor observation, and no validated engagement instruments were employed. The principle is therefore well grounded as a design heuristic across the study's trajectory, but its strongest claim, that reframed failure produces user-centred design thinking, rests on qualitative evidence that future studies should test with standardised measures.
7.5.6 Counter-Arguments and Alternative Explanations
The decline in Communication and Collaboration self-assessment scores observed in Cycle 3 (Section 6.4.2) warrants scrutiny of alternative explanations. While students' qualitative accounts suggest their evaluation standards became more stringent as they encountered more complex collaborative demands, this interpretation requires systematic examination of competing accounts. The following four alternatives are presented in order of their theoretical and empirical plausibility given the present data.
Alternative 1: Actual Competence Decline. The most straightforward explanation is that the observed decline reflects a genuine deterioration in collaborative performance: the increased task complexity simply exceeded students' collaborative capabilities, revealing deficits that the simpler Cycle 2 workflow had masked. This interpretation is the least supported by the present evidence. The qualitative data document more, not less, sophisticated negotiation in practice (self-organised governance, sustained rework, user-centred decision-making), and the matched comparison in Section 6.1.3 shows that the CC decline in Cycle 3 exceeded that of Cycle 2 students matched on pre-test score and gender, which is consistent with a contribution of the task, though not decisive (p = .059).
Alternative 2: Mood Congruence Bias. Students in Cycle 3 experienced significant frustration during the collaborative chaos phase, and this negative affect may have coloured their retrospective self-assessments at post-test (Forgas, 1995). Under this interpretation, the decline reflects transient emotional state rather than either a genuine competence deficit or a stable recalibration. The study design does not permit the temporal comparison needed to rule this account out, so it remains viable.
Alternative 3: Social Desirability Shift. In Cycle 2, where the task was relatively easy and collaboration superficial, students may have rated themselves generously because inflated self-assessment carried no social cost. In Cycle 3, where the task was demonstrably difficult and collaborative failures were publicly visible, students may have moderated their self-ratings to avoid appearing arrogant. Under this interpretation, the decline reflects a context-dependent shift in impression management rather than a change in competence or standards.
Alternative 4: Regression to the Mean. Excessively high pre-test scores tend to fall on retesting. The CC baseline was the highest of the five dimensions in Cycle 3 (M = 4.49, close to the instrument ceiling), so the statistical room for downward movement was maximal. This artefact is especially plausible because the sample was purposively selected for high initial competence.
Synthesis and Epistemic Stance. These four alternatives are not mutually exclusive. The recalibration explanation, that students applied more stringent criteria when judging their own collaborative competence after experiencing genuinely complex teamwork, offers the most coherent integration of the evidence: it accounts for the ceiling-high baseline, the breadth of the item-level decline, the larger decline relative to matched peers, and the richer collaborative behaviour documented qualitatively. However, coherence is not confirmation. A dedicated follow-up study employing retrospective pre-testing, in which participants rate their pre-intervention competence using their post-intervention evaluative criteria, would be required to adjudicate among these accounts.
7.6 Provisional Design Guideline: Maintain Digital Safety Awareness During Scaffolded Asset Integration
7.6.1 Guideline Statement
This guideline is derived from the same single-group design and should be treated as a provisional observation requiring dedicated empirical testing, not as a validated design principle. Teacher-mediated asset support may inadvertently lower students' self-reported digital safety awareness by making security and privacy decisions feel less salient: when AI tools handle content generation and the workflow runs on supervised institutional equipment, students may perceive that fewer safety-related decisions are required of them. This guideline proposes that explicit safety scaffolding be built into teacher-mediated AIGC VR workflows, though the proposition has not been systematically tested.
7.6.2 Cross-Cycle Evidence
Cycle 2 provided the primary evidence motivating this guideline: Digital Safety scores declined significantly (dz = −0.20, p = .026), and the item-level data localise the decline precisely. The personal-information item dropped significantly (dz = −0.29, p = .001), while the password item was unchanged and the copyright-awareness item actually improved (dz = 0.18, p = .049). T hree competing explanations follow. Under the scaffolded desensitisation hypothesis, students who routinely used AI-generated content without encountering negative consequences developed a complacent attitude towards protecting personal information. Under the measurement context hypothesis, the supervised laboratory setting, with institutional equipment and no personal devices, made privacy-protection items feel less relevant, attenuating responses independently of any competence change. The improvement in copyright awareness argues against a uniform loss of safety consciousness: the decline is specific to privacy and cautious communication rather than to all safety-related dispositions.
Cycle 3 adds a further data point. Under a design that continued teacher-mediated asset support, Digital Safety showed no significant change (dz = −0.12, p = .420). The decline observed in Cycle 2 therefore neither replicated at full strength nor reversed in Cycle 3, and the present data cannot distinguish whether this reflects the smaller sample, the different population, or a genuine moderation of the effect.
7.6.3 Guideline Status and Cycle 4 Requirements
This guideline is explicitly provisional and was not systematically tested in Cycle 3. Cycle 3's design focused on multimodal integration and collaborative complexity, and no dedicated safety scaffolding was introduced. A dedicated Cycle 4 would be required to test whether explicit safety scaffolding, such as mandatory attribution fields, copyright verification checklists, or guided discussions of AI-generated content licensing, can produce measurable improvements in Digital Safety self-assessment or behavioural indicators. Such a cycle should also employ the then-test methodology to distinguish measurement context effects from genuine awareness changes, and should include behavioural measures of safety practices, such as attribution frequency in platform logs. Without this empirical test, the safety implications of scaffolded asset integration in K-12 collaborative VR creation are speculative.
7.6.4 Implementation Conditions (Hypothetical)
Pending empirical verification, this guideline would apply under three hypothetical conditions: (a) students use teacher-mediated generative tools that automatically generate or modify digital assets; (b) the workflow does not require students to verify copyright, attribution, or privacy settings manually; and (c) prior competence assessments reveal adequate baseline safety awareness that might regress without scaffolding.
7.6.5 Proposed Operational Steps (Untested)
- Require manual attribution fields. Even when AI generates images, students must complete a "Source & Licence" metadata field before assets enter the shared repository.
- Conduct periodic safety audits during the project. At the midpoint and final stages, groups must review all assets using a checklist covering verifiable sources, appropriateness of external links, and group permission settings.
- Facilitate guided discussions on AI-generated content licensing before students begin teacher-mediated asset creation.
7.6.6 Evidence Strength
Evidence Strength: Weak. The Digital Safety decline in Cycle 2 (dz = −0.20; exploratory, Section 3.4.1) was statistically significant and localised at the item level, but it rests on a single cross-sectional observation with at least two plausible competing interpretations, and the effect did not replicate significantly in Cycle 3. No safety scaffolding was tested in any cycle, and no behavioural measures of safety practices were collected. The guideline is therefore provisional and requires a dedicated Cycle 4.
7.7 Limitations and Future Directions
7.7.1 Methodological Limitations
Confounding Structure of Cross-Cycle Comparisons. The three cycles differed in several respects: the samples (41, 130, and 47 students), the platforms (720yun, CLEVR with basic AIGC tools, and CLEVR with Kimi and Jimeng), the physical settings (outdoor and indoor versus indoor laboratories), the task themes (campus capture, fantasy worlds, and a Digital Dunhuang-inspired cultural narrative), and the level of AIGC availability (none, text-to-image, and multimodal generation). Because so many factors varied at once, the pedagogical changes alone cannot be said to have caused any observed differences. The progression from Cycle 1 to Cycle 3 tells a story of design evolution, not a controlled comparison that supports causal claims.
Absence of Control Groups. All three cycles used a single-group pre-test-post-test design.Without control conditions, the intervention itself cannot be identified as the definite cause of the competence changes: historical events, natural maturation, and repeated testing are alternative explanations. Practice effects could account for part of the gains in Information and Data Literacy and Digital Content Creation. They cannot, however, account for the full pattern because Digital Safety declined in Cycle 2 and Communication and Collaboration declined in Cycle 3, which test repetition alone would not produce.
Self-Selection Bias in Cycle 3 Purposive Sampling.The Cycle 3 sample was purposively selected from a high-achieving science and technology track. These students likely had higher baseline interest and self-efficacy in digital tasks, and the sample was smaller than Cycle 2 (N = 47 vs. 130), which reduces statistical power and increases the influence of outliers. Whether the Cycle 3 findings would hold in a general-education classroom or with lower-achieving students is unknown.
Common Method Bias from Repeated Self-Report.The same DigComp self-assessment scales were used for both pre-test and post-test, which creates common method bias (Podsakoff et al., 2003): students may have anchored their post-test answers to their pre-test answers. The study included no independently administered behavioural measures, teacher ratings, or objective performance tests for any competence dimension, so the self-report data lack corroborating evidence for several claims.
Inability to Distinguish Recalibration from Actual Competence Decline. The study design cannot determine which of two explanations accounts for the CC decline: raised self-assessment standards or a genuine decline in collaborative competence. Retrospective pre-testing is a way to decide between these options (Howard & Dailey, 1979; Sprangers & Schwartz, 1999), but it was not included. Section 7.5.6 lists four alternative explanations, and all are still possible.
Measurement Instrument as Trajectory Indicator Rather Than Diagnostic Tool.The confirmatory factor analysis (Section 3.4.1) showed limited convergent validity: three of the five dimensions had Average Variance Extracted below .50, and four had Composite Reliability below .70. The instrument therefore works best as a progress tracker that detects change within students over time, not as a precise diagnostic tool for absolute competence levels or fine-grained comparisons between students. The within-subjects pre-post design is a good fit for this use because it controls for individual baseline differences, but the scores should not guide high-stakes decisions or classify individual proficiency. Future research should lengthen each subscale to four or five items per dimension.
7.7.2 Practical Limitations
Generalisability Constraints. The participant profile, Grade 7 students in a well-resourced Chinese middle school with strong AI infrastructure, means that the findings may not generalise immediately to all K-12 contexts. Under-resourced schools or students with lower baseline skills might require substantially longer interventions to achieve the technical fluency that Cycles 1 and 2 developed in this sample. The Chinese educational context, with its collectivist classroom norms and high parental investment in academic achievement, may also have facilitated the collaborative dynamics observed in Cycle 3 in ways that would not replicate elsewhere.
Study Duration and Novelty Effects. The three design cycles took place over a single academic term. The data cannot confirm whether the elevated self-assessment standards and sustained engagement persist over extended periods, and part of the engagement with teacher-mediated generative tools may reflect a novelty effect that diminishes with repeated exposure. Longitudinal studies tracking the same cohorts over multiple terms would be required to address this limitation.
Platform Dependency. The intervention relied heavily on specific commercial platforms (Kimi, Jimeng, and the CLEVR system). The generative AI industry evolves rapidly, and these platforms continuously update their interfaces, algorithms, and pricing models; if a platform introduces a paywall, changes its core functions, or ceases operation, educators could not replicate the exact procedural steps of this study. The overarching design principles remain valid, but the specific technical guidelines require continuous updating and might become obsolete within short timeframes.
7.7.3 Future Directions
Testing the Provisional Digital Safety Guideline. The Digital Safety decline observed in Cycle 2 (dz = −0.20, p = .026) represents an unresolved DBR problem that demands attention. A dedicated Cycle 4 should test whether explicit safety scaffolding can reverse the decline in self-assessed Digital Safety scores, employing the then-test methodology to distinguish measurement context effects from genuine awareness changes, and including behavioural measures of safety practices alongside self-report assessments.
Longitudinal Verification of Self-Assessment Recalibration Patterns. Longitudinal studies are needed to determine whether the observed changes in students' self-assessment criteria persist over time. The CC decline documented in Cycle 3 could reflect either a temporary recalibration prompted by immediate task complexity or a durable shift in how students evaluate collaborative competence. Future research should track cohorts over a full academic year or longer, incorporating retrospective pre-test measures to distinguish durable changes in evaluative standards from transient task-specific effects.
Testing the Intervention Sequence in Diverse Settings. The design principles derived from this study should be tested in diverse educational settings, including general education classrooms and under-resourced schools, with pedagogical scaffolding adjusted for students with lower technical baselines. Comparing how different student demographics handle team coordination challenges would enrich the emerging theoretical understanding and establish its boundary conditions, with particular attention to cultural variables that may moderate the collaborative dynamics observed in this Chinese context.
AI as an Active Collaborative Partner. Future research should explore AI as an active collaborative partner rather than merely a cognitive prosthesis. In this study, students curated teacher-mediated text and image assets. Future studies could investigate how AI agents can mediate team dynamics, for example by integrating an AI monitor into collaborative platforms that analyses student interactions and suggests conflict resolution strategies when students disagree. Such AI-mediated conflict intervention raises significant ethical concerns regarding student privacy, autonomy, and algorithmic bias in judging collaborative behaviour, and these concerns must be addressed before implementation.
Cross-Disciplinary Integration. Researchers should integrate this VR storytelling model into specific academic subjects. Digital content creation should not remain a standalone technology class. Future studies could apply this workflow to cross-disciplinary education, for instance using AIGC and VR to reconstruct historical events in history classes or to visualise complex ecosystems in biology classes, moving beyond the generic digital competence outcomes that were the primary focus of this study.
7.8 Policy Implications
The four design principles and one provisional guideline align closely with emerging policy frameworks for digital competence and AI literacy in schools. The recommendations offered here are grounded in the study's empirical findings but are appropriately scoped to its boundary conditions.
7.8.1 Alignment with China's 2022 Information Technology Curriculum Standards
The research site is a mainland Chinese school governed by the national curriculum system, so the curriculum standards referenced in this chapter are the 2022 Compulsory Education Information Technology Curriculum Standards.
The design principles align with China's 2022 Information Technology Curriculum Standards, which emphasise digital literacy, computational thinking, and collaborative problem-solving as core competencies (Ministry of Education, 2022). Principle 1 supports the standards' emphasis on foundational digital literacy as a prerequisite for advanced application. Principle 2 aligns with the standards' explicit attention to collaborative problem-solving and communication. Principle 3 supports the computational thinking component by ensuring that students engage in design reasoning rather than passive consumption of AI-generated content. Principle 4 connects to the standards' broader goal of developing student resilience in digital environments.
The alignment also reveals a tension. The 2022 standards were formulated before the rapid proliferation of generative AI tools in K-12 classrooms, and they do not yet provide explicit guidance on how to integrate teacher-mediated assets into information technology curricula without undermining the computational thinking and problem-solving competencies they prioritise. The calibration principle proposed in this study, limiting generative tools to raw-material production while requiring manual integration and design reasoning, is a concrete instructional strategy for resolving this tension as the standards are revised for the generative AI era.
7.8.2 Connection to International Frameworks:DigComp 3.0
The study's findings resonate with international frameworks published or updated since 2024, including DigComp 3.0 (Cosgrove & Cachia, 2025), the AILit Framework (OECD & European Commission, 2025), and the UNESCO AI Competency Framework for Students (Miao et al., 2024). Before examining these connections, one boundary condition must be restated (Section 1.1.4): the generative tools in this intervention were teacher-mediated scaffolds, not student-facing learning objectives.
AIGC served as a workaround, not a competence target. The manual panoramic capture workflow in Cycle 1 generated insurmountable technical barriers, and teacher-mediated asset packages replaced this broken capture step so that students could redirect their effort towards collaborative VR storytelling, multimodal asset curation, and spatial narrative design. Teachers, not students, operated the generative tools (Skybox AI,Nano-Banana 2, Jimeng) because commercial AIGC platforms required individual mobile-phone registration, which violated school management protocols for underage users, and no education-specific interface with student-safe data governance was available. Consequently, this study does not claim to have measured or developed "AI literacy" as defined by DigComp 3.0's transversal AI competence dimension. The competence gains reported in Chapters 4 to 6 reflect digital content creation, problem-solving, and collaborative reasoning within AI-mediated environments, not the independent operation of generative AI tools. The findings nevertheless speak directly to the frameworks' shared concern: how schools can capture the benefits of AI-mediated creation without eroding the critical judgement that those frameworks make central, which is precisely the calibration problem addressed by Principle 3 and the provisional safety guideline.
7.8.3 Practical Implementation Roadmap for School Administrators
For school administrators contemplating the integration of collaborative VR creation, the findings suggest a phased roadmap that respects the sequential logic of the design principles while accommodating local resource constraints.
The roadmap is indicative rather than fixed: each phase may require up to an academic term, and the full sequence may require up to an academic year.
Phase 1: Infrastructure and Baseline Assessment (Months 1 to3).Assess baseline digital literacy across the student body using an adapted DigComp instrument, and evaluate technical infrastructure: reliable connectivity, device-to-student ratios, and physical spaces suitable for collaborative technology use. Schools that lack sufficient devices should not attempt concurrent co-editing workflows until device access is equitable; the Cycle 1 evidence shows that insufficient hardware produces unequal device control that undermines collaboration.
Phase 2: Technical Fluency Development (Months 4 to6). Following Principle 1, build technical fluency with core tools before introducing cognitively demanding creation tasks: basic VR navigation, file management, and simple image editing. Administrators should resist pressure to accelerate this phase; the Cycle 1 evidence demonstrates that unresolved technical barriers block subsequent competence development.
Phase 3: Structured Collaborative Introduction (Months 7 to9). Following Principle 2, introduce collaborative complexity through tasks with structural interdependence, ensuring that scheduling permits extended blocks of time (minimum 90 minutes) for genuine negotiation and redesign, and that classrooms allow face-to-face communication alongside screen-based collaboration. Platform-embedded collaboration analytics can support teachers in monitoring group dynamics during this phase without requiring specialised data-science expertise. The process analytics framework developed in this study, comprising an activity efficiency index (distinguishing productive creation actions from passive navigation), a contribution balance metric (flagging groups where one member dominates), and a collaboration timeline (revealing when groups work synchronously versus drift into individual silos), can be surfaced through teacher-facing dashboards as intuitive visual indicators. Administrators selecting platforms should prioritise systems that offer such built-in collaboration awareness tools.
Phase 4: Calibrated Asset Support Integration (Months 10 to12). Following Principle 3, introduce teacher-mediated generative tools with explicit constraints: raw-material generation only, with mandatory manual integration, spatial design, and navigational planning. Budget for teacher professional development on AIGC calibration, and pilot the candidate safety measures (attribution fields, licensing discussion) on a trial basis through mandatory attribution fields and periodic safety audits, pending empirical verification. This phased roadmap acknowledges that full implementation requires at least one academic year: meaningful competence development requires extended, scaffolded engagement rather than one-off technology exposure.
7.8.4 Teacher Professional Development Implications
The design principles carry significant implications for teacher professional development (TPD). Teachers implementing these principles require competencies beyond basic technology fluency: pedagogical judgement about difficulty management, facilitation skills for redirecting failure, and ethical awareness for AIGC calibration.
Teachers must be able to distinguish technical barriers, which should be reduced, from productive team coordination challenges, which should be scaffolded. This diagnostic capacity is not intuitive; the Cycle 1 evidence shows that teachers without specific preparation may mistake all student struggle for productive challenge, or conversely eliminate all difficulty in ways that undermine learning. TPD programmes should include structured observation protocols that help teachers classify the dominant barrier type in a given lesson and select appropriate scaffolding strategies.
Following Principle 4, teachers must develop facilitation skills for converting student frustration into design reasoning. TPD should provide a "failure playbook" of anticipated failure points matched to redirection prompts, tailored to the specific VR creation tools and task structures teachers will employ. Following Principle 3 and the provisional safety guideline, TPD content must go beyond tool training to address the instructional logic governing when and how AI assistance should be permitted, including ethical discussions about AI-generated content licensing, attribution, and bias. International frameworks for teacher AI competence, such as the UNESCO framework published in 2024, provide relevant structures for organising this content, particularly its AI pedagogy and AI ethics dimensions.
7.8.5 Equity and Access Considerations
All three DBR cycles were conducted in a well-resourced Chinese middle school with strong AI infrastructure, high-speed internet, and favourable student-to-device ratios. These conditions are not universal, and the design principles may require significant adaptation for under-resourced schools, rural communities, or regions with limited connectivity.
Device Access Equity. In Cycle 3, authentic collaboration did not require one device per student. It ran on one shared computer per group under the hub-and-spoke model, which keeps the workflow feasible in schools with limited hardware. The equity risk runs the other way: with a single operator, teachers must rotate the operating role and watch for domination, or the unequal participation pattern observed in Cycle 1 will reappear. Policy recommendations should therefore differentiate between schools with sufficient infrastructure, which can implement the full principle sequence, and schools with limited resources, which may need to begin with simplified technical tasks and paper-based collaborative planning before introducing digital co-editing.
Generative Tool Access Inequity. Generative AI tools are not universally accessible. Paywalls, regional restrictions, and language limitations (most high-quality generative tools operate primarily in English) create access barriers that this study's Chinese context did not fully capture because the participating students had strong English prompt-writing support and the school had premium tool subscriptions. Policymakers should not assume that scaffolded curricula are feasible for all schools without addressing these barriers through public funding or open-source alternatives.
Cultural Adaptation. The collaborative dynamics observed in Cycle 3, emergent self-organisation, peer-enforced norms, and collective responsibility for shared outcomes, may reflect collectivist cultural values that facilitated group cohesion. Schools in individualist cultural contexts may require additional scaffolding for collaborative norms, including explicit team-building activities and structured role assignments. The design principles should be treated as culturally bounded until tested across diverse cultural settings.
7.8.6 Recommendations for Curriculum Designers at District and National Levels
Competence-Based Curriculum Sequencing.The design principles support a competence-based curriculum sequence that progresses from technical fluency through collaborative complexity to calibrated AI integration, rather than introducing all elements simultaneously. National curricula should specify minimum progression criteria, such as demonstrating independent file management and basic VR navigation before advancing to collaborative multimodal projects.
Integrated Assessment Models. The study's reliance on self-report assessment revealed significant limitations, including common method bias and context-sensitivity effects. District and national assessment frameworks should integrate behavioural indicators, such as platform logs of collaborative editing, attribution frequency, and revision cycles, alongside self-report measures. The process analytics framework developed in this study (Section 3.5.2) is a model for such integrated assessment.
Safety-First AIGC Policy. Pending the dedicated Cycle 4 testing recommended above, policymakers should adopt a precautionary approach to teacher-mediated asset support in K-12 collaborative creation. Candidate measures, pending the dedicated Cycle 4 testing recommended above, include attribution requirements for AI-generated assets used in student projects, explicit curriculum attention to AI-generated content licensing, and restrictions on using AIGC for structural or navigational design in primary and lower-secondary grades. These measures align with the provisional safety guideline and with the risk-management orientation of the EU AI Act (European Commission, 2024), which requires deployers of AI systems to ensure adequate AI literacy among users.
Cross-Departmental Curriculum Integration.The study's finding that VR creation develops selected dimensions of digital competence where the workflow exercises them supports curriculum integration across departmental boundaries. Rather than confining VR creation to information technology classes, district curricula should enable cross-disciplinary projects in which history teachers guide content research, art teachers guide aesthetic design, language teachers guide narrative scripting, and IT teachers guide technical implementation. This model aligns with the AILit Framework's call for AI literacy as a transdisciplinary competence and with the UNESCO AI Competency Framework's emphasis on embedding AI-related learning across curricular areas.
Returning to the research questions. RQ1 asked how collaborative VR creation influences digital competence. The answer is selective rather than uniform development: gains concentrate in selected dimensions where the workflow exercises the competence, and decline where it removes the demand or where students recalibrate their own standards (Chapters 4-6). RQ2a identified technical, communication, and coordination challenges across the cycles; RQ2b linked each to the design features that addressed it; and RQ2c distilled four design principles and one provisional guideline (Sections 7.2-7.6).
Before closing, the five gaps of Chapter 1 can be re-read against the findings. Gap 1 is addressed directly by the three-cycle intervention. Gap 2 is traced within the teacher-mediated configuration of Cycles 2 and 3. Gap 3 is partially filled: platform logs trace creation actions, although chat semantics and copyright-related clicks were not analysed in this study. Gap 4 is partially filled: the three cohorts probe boundary conditions within one school, not across heterogeneous school contexts. Gap 5 yields four design principles and one provisional guideline (Sections 7.2-7.6).
7.9 Chapter Summary
This chapter has synthesised the empirical findings from three DBR cycles into four empirically grounded design principles and one provisional guideline for scaffolded collaborative VR creation in schools. The design principles are: (1) reduce technical barriers before introducing cognitive challenge; (2) scaffold genuine collaboration through structurally interdependent tasks; (3) calibrate AIGC assistance to preserve problem-solving demand; and (4) use dominant challenges as a pedagogical pivot, not an obstacle. The provisional guideline recommends maintaining explicit Digital Safety scaffolding during teacher-mediated asset support, though this proposition was not systematically tested and requires dedicated empirical verification.
These principles are grounded in cross-cycle comparative evidence but are offered as empirically informed heuristics rather than as experimentally validated causal laws. The chapter has presented counter-arguments and boundary conditions for each principle, acknowledging the strongest challenges from the desirable difficulties, individual differences, and expertise reversal literatures, and offering rebuttals proportionate to the available evidence.
The Cycle 3 CC decline has been interpreted as a potential recalibration of self-assessment standards, but this account remains one of several plausible explanations that the available data cannot definitively adjudicate. Four competing alternatives, actual competence decline, mood congruence bias, social desirability shift, and regression to the mean, were presented as viable interpretations (Section 7.5.6).
The chapter has acknowledged significant methodological limitations with appropriate explicitness: the confounding structure of cross-cycle comparisons, the absence of control groups, the self-selection bias in Cycle 3 purposive sampling, the common method bias from repeated self-report, the inability to distinguish recalibration from actual competence decline, and the limited convergent validity of the self-report instrument. Practical limitations concerning generalisability, study duration, and platform dependency have also been addressed.
Finally, the chapter has connected the study's findings with China's 2022 Information Technology Curriculum Standards, the DigComp 3.0 framework (Cosgrove & Cachia, 2025), the AILit Framework (OECD & European Commission, 2025), and the UNESCO AI Competency Framework for Students (Miao et al., 2024). The measurement instrument of this study was built on DigComp 2.1, so links to DigComp 3.0 are conceptual alignments, not measurement-level mappings.A phased implementation roadmap for school administrators, teacher professional development recommendations, equity and access considerations, and district-level curriculum design recommendations have been provided. These policy connections are offered as informed contributions to ongoing curriculum debates rather than as prescriptive mandates, consistent with the epistemic humility that the study's design and limitations warrant.
References
Al-Samarraie, H., & Saeed, N. (2018). A systematic review of cloud computing tools for collaborative learning: Opportunities and challenges to the blended-learning environment. Computers & Education, 124, 77-91. https://doi.org/10.1016/j.compedu.2018.05.016
Anderson, T., & Shattuck, J. (2012). Design-based research: A decade of progress in education research? Educational Researcher, 41(1), 16-25. https://doi.org/10.3102/0013189X11428813
Baker, R. S., & Siemens, G. (2014). Educational data mining and learning analytics. In R. K. Sawyer (Ed.), Cambridge handbook of the learning sciences (2nd ed., pp. 253-272). Cambridge University Press.
Baker, R. S., & Yacef, K. (2009). The state of educational data mining in 2009: A review and future visions. Journal of Educational Data Mining, 1(1), 3-17. https://doi.org/10.5281/zenodo.3554657
Bakharia, A., Corrin, L., de Barba, P., Kennedy, G., Gašević, D., Mulder, R., Williams, D., Dawson, S., & Lockyer, L. (2016). A conceptual framework linking learning design with learning analytics. Proceedings of the Sixth International Conference on Learning Analytics & Knowledge, 329-338. https://doi.org/10.1145/2883851.2883944
Bandura, A. (2006). Guide for constructing self-efficacy scales. In F. Pajares & T. Urdan (Eds.), Self-efficacy beliefs of adolescents (Vol. 5, pp. 307-337). Information Age Publishing.
Bao, H., & Bowen, J. P. (2025). From material conservation to digital presence: Reconstructing visitors' heritage experience and meaning-making through Digital Dunhuang. Heritage, 8(12), Article 534. https://doi.org/10.3390/heritage8120534
Barab, S., & Squire, K. (2004). Design-based research: Putting a stake in the ground. Journal of the Learning Sciences, 13(1), 1-14. https://doi.org/10.1207/s15327809jls1301_1
Barron, B. (2003). When smart groups fail. The Journal of the Learning Sciences, 12(3), 307–359. https://doi.org/10.1207/S15327809JLS1203_1
Beck, J. E., & Mostow, J. (2008). How who should practice: Using learning decomposition to evaluate the efficacy of different types of practice for different types of students. Proceedings of the 9th International Conference on Intelligent Tutoring Systems (pp. 353-362). Springer. https://doi.org/10.1007/978-3-540-69132-7_39
Bekele, M. K., Pierdicca, R., Frontoni, E., Malinverni, E. S., & Gain, J. (2018). A survey of augmented, virtual, and mixed reality for cultural heritage. Journal on Computing and Cultural Heritage (JOCCH), 11(2), Article 7. https://doi.org/10.1145/3145534
Belland, B. R. (2017). Instructional scaffolding in STEM education: Strategies and efficacy evidence. Springer.https://doi.org/10.1007/978-3-319-43565-0
Bentler, P. M. (1990). Comparative fit indexes in structural models. Psychological Bulletin, 107(2), 238-246.
Bentler, P. M., & Bonett, D. G. (1980). Significance tests and goodness of fit in the analysis of covariance structures. Psychological Bulletin, 88(3), 588-606.
Bjork, E. L., & Bjork, R. A. (2011). Making things hard on yourself, but in a good way: Creating desirable difficulties to enhance learning. In M. A. Gernsbacher, R. W. Pew, L. M. Hough, & J. R. Pomerantz (Eds.), Psychology and the real world: Essays illustrating fundamental contributions to society (pp. 56–64). Worth Publishers.
Blikstein, P. (2013). Digital fabrication and 'making' in education: The democratization of invention. In J. Walter-Herrmann & C. Büching (Eds.), FabLabs: Of machines, makers and inventors (pp. 203-222). Transcript Publishers. https://doi.org/10.14361/transcript.9783839423820.203
Blikstein, P., & Worsley, M. (2016). Children are not hackers: Building a culture of powerful ideas, deep learning, and equity in the maker movement. In K. Peppler, E. R. Halverson, & Y. B. Kafai (Eds.), Makeology: Makerspaces as learning environments (pp. 64-79). Routledge.
Braun, V., & Clarke, V. (2006). Using thematic analysis in psychology. Qualitative Research in Psychology, 3(2), 77-101. https://doi.org/10.1191/1478088706qp063oa
British Educational Research Association. (2018). Ethical guidelines for educational research (4th ed.). https://www.bera.ac.uk/publication/ethical-guidelines-for-educational-research-2018
Bronfenbrenner, U. (1977). Toward an experimental ecology of human development. American Psychologist, 32(7), 513-531. https://doi.org/10.1037/0003-066X.32.7.513
Bronfenbrenner, U. (1979). The ecology of human development: Experiments by nature and design. Harvard University Press.
Brown, A. L. (1992). Design experiments: Theoretical and methodological challenges in creating complex interventions in classroom settings. Journal of the Learning Sciences, 2(2), 141-178. https://doi.org/10.1207/s15327809jls0202_2
Bruner, J. S. (1990). Acts of meaning. Harvard University Press.
Calvani, A., Cartelli, A., Fini, A., & Ranieri, M. (2008). Models and instruments for assessing digital competence at school. Journal of e-Learning and Knowledge Society, 4(3), 183-193.
Calvani, A., Fini, A., & Ranieri, M. (2010). Digital competence in K-12: Theoretical models, assessment tools and empirical research. Analisi, 40, 157-171.
Carretero, S., Vuorikari, R., & Punie, Y. (2017). DigComp 2.1: The digital competence framework for citizens with eight proficiency levels and examples of use (EUR 28558 EN). Publications Office of the European Union. https://doi.org/10.2760/38842
Chang, H., Park, J., & Suh, J. (2023). Virtual reality as a pedagogical tool: An experimental study of English learner in lower elementary grades. Education and Information Technologies, 29(4), 4809-4842. https://doi.org/10.1007/s10639-023-11988-y
Checa, D., & Bustillo, A. (2020). A review of immersive virtual reality serious games to enhance learning and training. Multimedia Tools and Applications, 79(9-10), 5501-5527. https://doi.org/10.1007/s11042-019-08348-9
Chen, L., Chen, P., & Lin, Z. (2020). Artificial intelligence in education: A review. IEEE Access, 8, 75264-75278. https://doi.org/10.1109/ACCESS.2020.2988510
Christopoulos, A., Conrad, M., & Shukla, M. (2018). Increasing student engagement through virtual interactions: How? Virtual Reality, 22(4), 353-369. https://doi.org/10.1007/s10055-017-0330-3
Chu, S. L., Quek, F., Bhangaonkar, S., Ging, A. B., & Sridharamurthy, K. (2015). Making the maker: A means-to-an-ends approach to nurturing the maker mindset in elementary-aged children. International Journal of Child-Computer Interaction, 5, 11–19. https://doi.org/10.1016/j.ijcci.2015.08.002
Cobb, P., Confrey, J., diSessa, A., Lehrer, R., & Schauble, L. (2003). Design experiments in educational research. Educational Researcher, 32(1), 9-13. https://doi.org/10.3102/0013189X032001009
Coelho, H., Melo, M., Martins, J., & Bessa, M. (2019). Collaborative immersive authoring tool for real-time creation of multisensory VR experiences. Multimedia Tools and Applications, 78(14), 19473-19493. https://doi.org/10.1007/s11042-019-7309-x
Cohen, J. (1988). Statistical power analysis for the behavior al sciences (2nd ed.). Lawrence Erlbaum Associates.
Collins, A. (1992). Toward a design science of education. In E. Scanlon & T. O'Shea (Eds.), New directions in educational technology (pp. 15-22). Springer. https://doi.org/10.1007/978-3-642-77708-9_2
Collins, A., Brown, J. S., & Newman, S. E. (1989). Cognitive apprenticeship: Teaching the crafts of reading, writing, and mathematics. In L. B. Resnick (Ed.), Knowing, learning, and instruction: Essays in honor of Robert Glaser (pp. 453–494). Lawrence Erlbaum Associates.
Collins, A., Joseph, D., & Bielaczyc, K. (2004). Design research: Theoretical and methodological issues. Journal of the Learning Sciences, 13(1), 15-42. https://doi.org/10.1207/s15327809jls1301_2
Cosgrove, J., & Cachia, R. (2025). DigComp 3.0: European digital competence framework (5th ed.). Publications Office of the European Union.https://doi.org/10.2760/0001149
Creswell, J. W., & Miller, D. L. (2000). Determining validity in qualitative inquiry. Theory into Practice, 39(3), 124-130. https://doi.org/10.1207/s15430421tip3903_2
Creswell, J. W., & Plano Clark, V. L. (2018). Designing and conducting mixed methods research (3rd ed.). SAGE Publications.
Csikszentmihalyi, M. (1990). Flow: The psychology of optimal experience. Harper & Row.
Cumming, G., & Finch, S. (2001). A primer on the understanding, use, and calculation of confidence intervals that are based on central and noncentral distributions. Educational and Psychological Measurement, 61(4), 532-574.
Damgaard, C., & Weiner, J. (2000). Describing inequality in plant size or fecundity. Ecology, 81(4), 1139-1142. https://doi.org/10.1890/0012-9658(2000)081[1139:DIIPSO]2.0.CO;2
Denzin, N. K. (2017). The research act: A theoretical introduction to sociological methods (3rd ed.). Routledge.
Design-Based Research Collective. (2003). Design-based research: An emerging paradigm for educational inquiry. Educational Researcher, 32(1), 5-8. https://doi.org/10.3102/0013189X032001005
DeVellis, R. F. (2016). Scale development: Theory and applications (4th ed.). SAGE Publications.
Dewey, J. (1938). Experience and education. Macmillan.
Dillenbourg, P. (1999). What do you mean by collaborative learning? In P. Dillenbourg (Ed.), Collaborative-learning: Cognitive and computational approaches (pp. 1-19). Pergamon.
Dillenbourg, P. (2013). Design for classroom orchestration. Computers & Education, 69, 485–492. https://doi.org/10.1016/j.compedu.2013.04.013
Dillenbourg, P., & Jermann, P. (2007). Designing integrative scripts. In F. Fischer, I. Kollar, H. Mandl, & J. M. Haake (Eds.), Scripting computer-supported collaborative learning (pp. 275–301). Springer. https://doi.org/10.1007/978-0-387-36949-5_16
Dimitrov, D. M., & Rumrill, P. D. (2003).pre-test-post-test designs and measurement of change. Work: A Journal of Prevention, Assessment & Rehabilitation, 20(2), 159-165.
Dunnagan, C. L., Dannenberg, D. A., Cuales, M. P., Earnest, A. D., Gurnsey, R. M., & Gallardo-Williams, M. T. (2020). Production and evaluation of a realistic immersive virtual reality organic chemistry laboratory experience: Infrared spectroscopy. Journal of Chemical Education, 97(1), 258-262. https://doi.org/10.1021/acs.jchemed.9b00705
Ertmer, P. A. (1999). Addressing first- and second-order barriers to change: Strategies for technology integration. Educational Technology Research and Development, 47(4), 47-61. https://doi.org/10.1007/BF02299597
Ertmer, P. A., & Ottenbreit-Leftwich, A. T. (2010). Teacher technology change: How knowledge, confidence, beliefs, and culture intersect. Journal of Research on Technology in Education, 42(3), 255-284. https://doi.org/10.1080/15391523.2010.10782551
European Commission. (2024). Regulation (EU) 2024/1689 laying down harmonised rules on artificial intelligence (Artificial Intelligence Act). Official Journal of the European Union, L, 12 July 2024.
Falloon, G. (2020). From digital literacy to digital competence: The teacher digital competence (TDC) framework. Educational Technology Research and Development, 68(5), 2449-2472. https://doi.org/10.1007/s11423-020-09767-4
Faul, F., Erdfelder, E., Buchner, A., & Lang, A.-G. (2009). Statistical power analyses using G*Power 3.1: Tests for correlation and regression analyses.Behavior Research Methods, 41(4), 1149-1160. https://doi.org/10.3758/BRM.41.4.1149
Fereday, J., & Muir-Cochrane, E. (2006). Demonstrating rigor using thematic analysis: A hybrid approach of inductive and deductive coding and theme development. International Journal of Qualitative Methods, 5(1), 80-92.
Ferrari, A. (2013). DigComp: A framework for developing and understanding digital competence in Europe (EUR 26035). Publications Office of the European Union. https://doi.org/10.2788/52966
Fetters, M. D., Curry, L. A., & Creswell, J. W. (2013). Achieving integration in mixed methods designs-Principles and practices. Health Services Research, 48(6pt2), 2134-2156. https://doi.org/10.1111/1475-6773.12117
Fielding, N. G. (2012). Triangulation and mixed methods designs: Data integration with new research technologies. Journal of Mixed Methods Research, 6(2), 124-136. https://doi.org/10.1177/1558689812431601
Fishman, B. J., Penuel, W. R., Allen, A.-R., Cheng, B. H., & Sabelli, N. (2013). Design-based implementation research: An emerging model for transforming the relationship of research and practice. National Society for the Study of Education Yearbook, 112(2), 136–156.
Flick, U. (2018). An introduction to qualitative research (6th ed.). SAGE Publications.
Forgas, J. P. (1995). Mood and judgment: The affect infusion model (AIM). Psychological Bulletin, 117(1), 39–66. https://doi.org/10.1037/0033-2909.117.1.39
Fornell, C., & Larcker, D. F. (1981). Evaluating structural equation models with unobservable variables and measurement error. Journal of Marketing Research, 18(1), 39-50. https://doi.org/10.1177/002224378101800104
Fraillon, J., Ainley, J., Schulz, W., Friedman, T., & Duckworth, D. (2020). Preparing for life in a digital world: IEA International Computer and Information Literacy Study 2018 international report. Springer.https://doi.org/10.1007/978-3-030-38781-5
Gokhale, A. A. (1995). Collaborative learning enhances critical thinking. Journal of Technology Education, 7(1), 22-30. https://doi.org/10.21061/jte.v7i1.a.2
Guetterman, T. C., Fetters, M. D., & Creswell, J. W. (2015). Integrating quantitative and qualitative results in health science mixed methods research through joint displays. Annals of Family Medicine, 13(6), 554-561. https://doi.org/10.1370/afm.1865
Hadwin, A., Järvelä, S., & Miller, M. (2017). Self-regulation, co-regulation, and shared regulation in collaborative learning environments. In D. H. Schunk & J. A. Greene (Eds.), Handbook of self-regulation of learning and performance (2nd ed., pp. 83-106). Routledge. https://doi.org/10.4324/9781315697048-5
Hair, J. F., Black, W. C., Babin, B. J., & Anderson, R. E. (2019). Multivariate data analysis (9th ed.). Cengage Learning.
Halverson, E. R., & Sheridan, K. (2014). The maker movement in education. Harvard Educational Review, 84(4), 495-504. https://doi.org/10.17763/haer.84.4.34j1g68140382063
Hatano, G., & Inagaki, K. (1986). Two courses of expertise. In H. W. Stevenson, H. Azuma, & K. Hakuta (Eds.), Child development and education in Japan (pp. 262–272). W. H. Freeman.
Hatlevik, O. E., Throndsen, I., Loi, M., & Gudmundsdottir, G. B. (2018). Students' ICT self-efficacy and computer and information literacy: Determinants and relationships. Computers & Education, 118, 107-119. https://doi.org/10.1016/j.compedu.2017.11.011
Henseler, J., Ringle, C. M., & Sarstedt, M. (2015). A new criterion for assessing discriminant validity in variance-based structural equation modeling. Journal of the Academy of Marketing Science, 43(1), 115-135.
Herman, L., & Hutka, S. (2019). Virtual artistry: Virtual reality translations of two-dimensional creativity. In Proceedings of the 2019 on Creativity and Cognition (pp. 612-618). ACM. https://doi.org/10.1145/3325480.3326579
Hernández-Leo, D., Martinez-Maldonado, R., Pardo, A., Muñoz-Cristóbal, J. A., & Rodríguez-Triana, M. J. (2019). Analytics for learning design: A layered framework and tools. British Journal of Educational Technology, 50(1), 139-152. https://doi.org/10.1111/bj et12645
Hoenig, J. M., & Heisey, D. M. (2001). The abuse of power: The pervasive fallacy of power calculations for data analysis. The American Statistician, 55(1), 19-24.
Holmes, W., Bialik, M., & Fadel, C. (2019). Artificial intelligence in education: Promises and implications for teaching and learning. Center for Curriculum Redesign.
Howard, G. S., & Dailey, P. R. (1979). Response-shift bias: A source of contamination of self-report measures. Journal of Applied Psychology, 64(2), 144-150. https://doi.org/10.1037/0021-9010.64.2.144
Howard, S. K., Tondeur, J., Siddiq, F., & Scherer, R. (2021). Ready, set, go! Profiling teachers' readiness for online teaching in secondary education. Technology, Pedagogy and Education, 30(1), 141-158. https://doi.org/10.1080/1475939X.2020.1839543
Hu, L., & Bentler, P. M. (1999). Cutoff criteria for fit indexes in covariance structure analysis: Conventional criteria versus new alternatives. Structural Equation Modeling, 6(1), 1-55. https://doi.org/10.1080/10705519909540118
Hu, X. (2018). Usability evaluation of E-Dunhuang cultural heritage digital library. Data and Information Management, 2(2), 57-69. https://doi.org/10.2478/dim-2018-0008
IBM Corp. (2020). IBM SPSS Statistics for Windows (Version 27.0) [Computer software]. IBM Corp.
Igolkina, A. A., & Meshcheryakov, G. (2020). semopy: A Python package for structural equation modeling. PeerJ, 8, e9529. https://doi.org/10.7717/peerj.9529
Ilomäki, L., Paavola, S., Lakkala, M., & Kantosalo, A. (2016). Digital competence- an emergent boundary concept for policy and educational research. Education and Information Technologies, 21(3), 655-679. https://doi.org/10.1007/s10639-014-9346-4
International Society for Technology in Education. (2016). ISTE standards for students. https://www.iste.org/standards/students
Jenkins, H., Ito, M., & boyd, d. (2016). Participatory culture in a networked era: A conversation on youth, learning, commerce, and politics. Polity Press.
Jensen, L., & Konradsen, F. (2018). A review of the use of virtual reality head-mounted displays in education and training. Education and Information Technologies, 23(4), 1515-1529. https://doi.org/10.1007/s10639-017-9676-0
Johnson, D. W., & Johnson, R. T. (2009). An educational psychology success story: Social interdependence theory and cooperative learning. Educational Researcher, 38(5), 365-379. https://doi.org/10.3102/0013189X09339057
Johnson, R. B., & Onwuegbuzie, A. J. (2004). Mixed methods research: A research paradigm whose time has come. Educational Researcher, 33(7), 14-26. https://doi.org/10.3102/0013189X033007014
Kafai, Y., & Resnick, M. (Eds.). (1996). Constructionism in practice: Designing, thinking, and learning in a digital world. Lawrence Erlbaum Associates.
Kafai, Y., & Burke, Q. (2014). Connected code: Why children need to learn programming. MIT Press.
Kalyuga, S. (2007). Expertise reversal effect and its implications for learner-tailored instruction. Educational Psychology Review, 19(4), 509-539. https://doi.org/10.1007/s10648-007-9054-3
Kemmis, S., & McTaggart, R. (2005). Participatory action research: Communicative action and the public sphere. In N. K. Denzin & Y. S. Lincoln (Eds.), The SAGE handbook of qualitative research (3rd ed., pp. 559-603). SAGE Publications.
Kirschner, P. A., Sweller, J., & Clark, R. E. (2006). Why minimal guidance during instruction does not work: An analysis of the failure of constructivist, discovery, problem-based, experiential, and inquiry-based teaching. Educational Psychologist, 41(2), 75-86. https://doi.org/10.1207/s15326985ep4102_1
Kirschner, P. A., Sweller, J., Kirschner, F., & Zambrano, J. (2018). From cognitive load theory to collaborative cognitive load theory. International Journal of Computer-Supported Collaborative Learning, 13(2), 213-233. https://doi.org/10.1007/s11412-018-9277-y
Kline, R. B. (2015). Principles and practice of structural equation modeling (4th ed.). Guilford Press.
Knapp, T. R., & Schafer, W. D. (2009). From t to z to p to d: Four forgotten formulas from the past. Paper presented at the Annual Meeting of the American Educational Research Association, San Diego, CA.
König, J., Jäger-Biela, D. J., & Glutsch, N. (2020). Adapting to online teaching during COVID-19 school closure: Teacher education and teacher competence effects among early career teachers in Germany. European Journal of Teacher Education, 43(4), 608-622. https://doi.org/10.1080/02619768.2020.1809650
Krajcik, J. S., & Blumenfeld, P. C. (2006). Project-based learning. In R. K. Sawyer (Ed.), The Cambridge handbook of the learning sciences (pp. 317-333). Cambridge University Press.
Krueger, R. A., & Casey, M. A. (2015). Focus groups: A practical guide for applied research (5th ed.). SAGE Publications.
Lakens, D. (2013). Calculating and reporting effect sizes to help cumulative science: A practical primer for t-tests and ANOVAs. Frontiers in Psychology, 4, 863. https://doi.org/10.3389/fpsyg.2013.00863
Landis, J. R., & Koch, G. G. (1977). The measurement of observer agreement for categorical data. Biometrics, 33(1), 159-174. https://doi.org/10.2307/2529310
Lawshe, C. H. (1975). A quantitative approach to content validity. Personnel Psychology, 28(4), 563-575. https://doi.org/10.1111/j.1744-6570.1975.tb01393.x
Li, Y., & Ranieri, M. (2010). Are 'digital natives' really digitally competent? A study on Chinese teenagers. British Journal of Educational Technology, 41(6), 1029-1042. https://doi.org/10.1111/j.1467-8535.2009.01053.x
Lincoln, Y. S., & Guba, E. G. (1985). Naturalistic inquiry. SAGE Publications.
Liu, D., Dede, C., Huang, R., & Richards, J. (Eds.). (2017). Virtual, augmented, and mixed realities in education. Springer. https://doi.org/10.1007/978-981-10-5490-7
Livingstone, S., Mascheroni, G., Dreier, M., Chaudron, S., & Lagae, K. (2015). How parents of young children manage digital devices at home: The role of income, education and parental style. EU Kids Online, LSE. https://doi.org/10.21953/lse.47fdeqj01ofo
Long, D., & Magerko, B. (2020). What is AI literacy? Competencies and design considerations. Proceedings of the 2020 CHI Conference on Human Factors in Computing Systems, 1-16. https://doi.org/10.1145/3313831.3376727
Lui, C., Not, C., & Wong, G. K. W. (2023). Theory-based learning design with immersive virtual reality in science education: A systematic review. Journal of Science Education and Technology, 32(3), 390-432. https://doi.org/10.1007/s10956-023-10035-2
Lui, D., Walker, J. T., Hanna, S., Kafai, Y. B., Fields, D., & Jayathirtha, G. (2020). Communicating computational concepts and practices within high school students' portfolios of making electronic textiles. Interactive Learning Environments, 28(3), 284-301. https://doi.org/10.1080/10494820.2019.1612446
MacCallum, R. C., Browne, M. W., & Sugawara, H. M. (1996). Power analysis and determination of sample size for covariance structure modeling. Psychological Methods, 1(2), 130-149.
Makransky, G., & Lilleholt, L. (2018). A structural equation modeling investigation of the relationship between perceived immersion and learning in virtual reality learning environments. Educational Technology Research and Development, 66(6), 1141-1164. https://doi.org/10.1007/s11423-018-9602-2
Makransky, G., & Petersen, G. B. (2019). Immersive virtual reality and learning: A meta-analysis. Educational Psychology Review, 31(2), 531-548. https://doi.org/10.1007/s10648-019-09486-6
Makransky, G., & Petersen, G. B. (2021). The cognitive affective model of immersive learning (CAMIL): A theoretical research-based model of learning in immersive virtual reality. Educational Psychology Review, 33(3), 937-958. https://doi.org/10.1007/s10648-020-09586-2
Makransky, G., Terkildsen, T. S., & Mayer, R. E. (2019). Adding immersive virtual reality to a science lab simulation causes more presence but less learning. Learning and Instruction, 60, 225-236. https://doi.org/10.1016/j.learninstruc.2017.12.007
Marschan-Piekkari, R., & Reis, C. (2004). Language and languages in cross-cultural interviewing. In R. Marschan-Piekkari & C. Welch (Eds.), Handbook of qualitative research methods for international business (pp. 224-243). Edward Elgar.
Martin, L. (2015). The promise of the maker movement for education. Journal of Pre-College Engineering Education Research (J-PEER), 5(1), 30-39. https://doi.org/10.7771/2157-9288.1099
Matovu, H., Ungu, D. A. K., Won, M., Treagust, D. F., Tsai, C.-C., Park, J., Mocerino, M., & Tasker, R. (2023). Immersive virtual reality for science learning: Design, implementation, and evaluation. Studies in Science Education, 59(2), 205-244. https://doi.org/10.1080/03057267.2022.2082680
Maxwell, J. A. (2013). Qualitative research design: An interactive approach (3rd ed.). SAGE Publications.
Maxwell, J. A., & Delaney, H. D. (2004). Designing experiments and analyzing data: A model comparison perspective (2nd ed.). Lawrence Erlbaum Associates.
Mayer, R. E. (2004). Should there be a three-strikes rule against pure discovery learning? American Psychologist, 59(1), 14–19. https://doi.org/10.1037/0003-066X.59.1.14
McKenney, S., & Reeves, T. C. (2019). Conducting educational design research (2nd ed.). Routledge. https://doi.org/10.4324/9781315105642
Merchant, Z., Goetz, E. T., Cifuentes, L., Keeney-Kennicutt, W., & Davis, T. J. (2014). Effectiveness of virtual reality-based instruction on students' learning outcomes in K-12 and higher education: A meta-analysis. Computers & Education, 70, 29-40. https://doi.org/10.1016/j.compedu.2013.07.033
Meredith, W. (1993). Measurement invariance, factor analysis and factorial invariance. Psychometrika, 58(4), 525-543.
Metzger, M. J., Flanagin, A. J., & Medders, R. B. (2010). Social and heuristic approaches to credibility evaluation online. Journal of Communication, 60(3), 413–439. https://doi.org/10.1111/j.1460-2466.2010.01488.x
Miao, F., Shiohira, K., & Lao, N. (2024). AI competency framework for students. UNESCO. https://doi.org/10.54675/JKJB9835
Mikropoulos, T. A., & Natsis, A. (2011). Educational virtual environments: A ten-year review of empirical research 1999-2009. Computers & Education, 56(3), 769-780. https://doi.org/10.1016/j.compedu.2010.10.020
Ministry of Education of the People's Republic of China. (2022). 义务教育信息科技课程标准(2022年版) [Information technology curriculum standards for compulsory education].
Ministry of Education of the People's Republic of China. (2024). Notice on strengthening artificial intelligence education in primary and secondary schools (教基厅函〔2024〕32号) [教育部办公厅关于加强中小学人工智能教育的通知].
Morgan, D. L. (1997). Focus groups as qualitative research (2nd ed.). SAGE Publications.
Mu, S., Cui, M., & Huang, X. (2020). Multimodal data fusion in learning analytics: A systematic review.Sensors, 20(23), 6856.https://doi.org/10.3390/s20236856
Muñoz, J., Mehrabi, S., Li, Y., Basharat, A., Middleton, L. E., Cao, S., Barnett-Cowan, M., & Boger, J. (2022). Immersive virtual reality exergames for persons living with dementia: User-centred design study as a multistakeholder team during the COVID-19 pandemic. JMIR Serious Games, 10(1), e29987. https://doi.org/10.2196/29987
Mystakidis, S. (2022). Metaverse. Encyclopedia, 2(1), 486-497. https://doi.org/10.3390/encyclopedia2010031
Ng, J. T. D., Wang, Z., & Hu, X. (2022). Needs analysis and prototype evaluation of student-facing LA dashboard for virtual reality content creation. In LAK22: 12th International Learning Analytics and Knowledge Conference (pp. 444-450). ACM. https://doi.org/10.1145/3506860.3506880
Nosek, B. A., Ebersole, C. R., DeHaven, A. C., & Mellor, D. T. (2018). The preregistration revolution. Proceedings of the National Academy of Sciences, 115(11), 2600-2606. https://doi.org/10.1073/pnas.1708274114
Nunnally, J. C., & Bernstein, I. H. (1994). Psychometric theory (3rd ed.). McGraw-Hill.
Ochoa, X. (2022). Multimodal learning analytics-Rationale, process, examples, and direction. In C. Lang, G. Siemens, A. F. Wise, D. Gašević, & A. Merceron (Eds.), The handbook of learning analytics (2nd ed., pp. 54-65). SoLAR. https://doi.org/10.18608/hla22.006
OECD & European Commission. (2025). Empowering learners for the age of AI: An AI literacy framework for primary and secondary education (Draft). OECD Publishing.
OECD. (2019). OECD future of education and skills 2030: OECD learning compass 2030. OECD Publishing.
Oswald, K., & Zhao, X. (2021). Collaborative learning in makerspaces: A grounded theory of the role of collaborative learning in makerspaces. SAGE Open, 11(2), 21582440211020732. https://doi.org/10.1177/21582440211020732
Palinkas, L. A., Horwitz, S. M., Green, C. A., Wisdom, J. P., Duan, N., & Hoagwood, K. (2015). Purposeful sampling for qualitative data collection and analysis in mixed method implementation research. Administration and Policy in Mental Health and Mental Health Services Research, 42(5), 533-544. https://doi.org/10.1007/s10488-013-0528-y
Panagiotidis, P. (2021). Virtual reality applications and language learning. International Journal for Cross-Disciplinary Subjects in Education (IJCDSE), 12(2), 4447-4454. https://doi.org/10.20533/ijcdse.2042.6364.2021.0551
Pangrazio, L., & Sefton-Green, J. (2021). Digital rights, digital citizenship and digital literacy: What's the difference? Journal of New Approaches in Educational Research, 10(1), 15-27. https://doi.org/10.7821/naer.2021.1.616
Papanastasiou, G., Drigas, A., Skianis, C., Lytras, M., & Papanastasiou, E. (2019). Virtual and augmented reality effects on K-12, higher and tertiary education students' twenty-first century skills. Virtual Reality, 23(4), 425-436. https://doi.org/10.1007/s10055-018-0363-2
Papavlasopoulou, S., Giannakos, M. N., & Jaccheri, L. (2017). Empirical studies on the Maker Movement, a promising approach to learning: A literature review. Entertainment Computing, 18, 57-78. https://doi.org/10.1016/j.entcom.2016.09.002
Papavlasopoulou, S., Giannakos, M. N., & Jaccheri, L. (2019). Exploring children's learning experience in constructionism-based coding activities through design-based research. Computers in Human Behavior, 99, 415-427. https://doi.org/10.1016/j.chb.2019.01.008
Papert, S. (1980). Mindstorms: Children, computers, and powerful ideas. Basic Books.
Papert, S., & Harel, I. (Eds.). (1991). Constructionism. Ablex Publishing Corporation.
Parong, J., & Mayer, R. E. (2018). Learning science in immersive virtual reality. Journal of Educational Psychology, 110(6), 785–797.https://doi.org/10.1037/edu0000241
Patton, M. Q. (2015). Qualitative research & evaluation methods: Integrating theory and practice (4th ed.). SAGE Publications.
Pea, R. D. (2004). The social and technological dimensions of scaffolding and related theoretical concepts for learning, education, and human activity. Journal of the Learning Sciences, 13(3), 423-451.
Pellas, N., Mystakidis, S., & Kazanidis, I. (2021). Immersive virtual reality in K-12 and higher education: A systematic review of the last decade scientific literature. Virtual Reality, 25(3), 835-861. https://doi.org/10.1007/s10055-020-00489-9
Peppler, K., & Bender, S. (2013). Maker movement spreads innovation one project at a time. Phi Delta Kappan, 95(3), 22-27. https://doi.org/10.1177/003172171309500306
Phillips, D. C. (1995). The good, the bad, and the ugly: The many faces of constructivism. Educational Researcher, 24(7), 5-12. https://doi.org/10.3102/0013189X024007005
Piaget, J. (1952). The origins of intelligence in children. International Universities Press.
Piaget, J. (1972). The principles of genetic epistemology. International Library of Philosophy and Scientific Method. Routledge & Kegan Paul.
Podsakoff, P. M., MacKenzie, S. B., Lee, J. Y., & Podsakoff, N. P. (2003). Common method biases in behavior al research: A critical review of the literature and recommended remedies. Journal of Applied Psychology, 88(5), 879-903. https://doi.org/10.1037/0021-9010.88.5.879
Polit, D. F., & Beck, C. T. (2006). The content validity index: Are you sure you know what's being reported? Research in Nursing & Health, 29(5), 489–497. https://doi.org/10.1002/nur.20160
Prensky, M. (2001). Digital natives, digital immigrants. On the Horizon, 9(5), 1-6. https://doi.org/10.1108/10748120110424816
Prinsloo, P., & Slade, S. (2017). Ethics and learning analytics: Charting the (un)charted. In C. Lang, G. Siemens, A. Wise, & D. Gašević (Eds.), Handbook of learning analytics (pp. 49-57). SoLAR. https://doi.org/10.18608/hla17.004
Que, Y., Cheng, L., Zhang, T., Chan, C. K. K., & Hu, X. (2025). Comparing collaboration patterns in virtual reality content co-creation activities between high- and low-performing secondary school students. In CSCL 2025 Proceedings (pp. 675-677). International Society of the Learning Sciences.
Quintana, C., Reiser, B. J., Davis, E. A., Krajcik, J., Fretz, E., Duncan, R. G., Kyza, E., Edelson, D., & Soloway, E. (2004). A scaffolding design framework for software to support science inquiry. The Journal of the Learning Sciences, 13(3), 337–386. https://doi.org/10.1207/s15327809jls1303_2
Radianti, J., Majchrzak, T. A., Fromm, J., & Wohlgenannt, I. (2020). A systematic review of immersive virtual reality applications for higher education: Design elements, lessons learned, and research agenda. Computers & Education, 147, 103778.https://doi.org/10.1016/j.compedu.2019.103778
Redecker, C. (2017). European framework for the digital competence of educators: DigCompEdu (Y. Punie, Ed.). Publications Office of the European Union.https://doi.org/10.2760/159770
Reeves, T. C. (2006). Design research from a technology perspective. In J. van den Akker, K. Gravemeijer, S. McKenney, & N. Nieveen (Eds.), Educational design research (pp. 52-66). Routledge.
Reich, J. (2020). Failure to disrupt: Why technology alone can't transform education. Harvard University Press.
Reimann, P. (2009). Time is precious: Variable- and event-centred approaches to process analysis in CSCL research. International Journal of Computer-Supported Collaborative Learning, 4(3), 239-257.https://doi.org/10.1007/s11412–009-9070-z
Reimann, P. (2011). Design-based research. In L. Markauskaite, P. Freebody, & J. Irwin (Eds.), Methodological choice and design: Scholarship, policy and practice in social and educational research (pp. 101-113). Springer. https://doi.org/10.1007/978–90-481–8933-5_8
Reiser, B. J. (2004). Scaffolding complex learning: The mechanisms of structuring and problematizing student work. The Journal of the Learning Sciences, 13(3), 273–304. https://doi.org/10.1207/s15327809jls1303_1
Resta, P., & Laferrière, T. (2007). Technology in support of collaborative learning. Educational Psychology Review, 19(1), 65-83. https://doi.org/10.1007/s10648–007-9042-7
Ribble, M. (2015). Digital citizenship in schools (3rd ed.). International Society for Technology in Education
Rogat, T. K., & Linnenbrink-Garcia, L. (2011). Socially shared regulation in collaborative groups: An analysis of the interplay between quality of social regulation and group processes. Cognition and Instruction, 29(4), 375–415. https://doi.org/10.1080/07370008.2011.607930.
Rosenbaum, P. R. (2002). Observational studies (2nd ed.). Springer. https://doi.org/10.1007/978-1–4757-3692-2
Sandoval, W. A. (2014). Conjecture mapping: An approach to systematically based research in education. In A. Kelly, R. Lesh, & J. Baek (Eds.), Handbook of design research methods in education: Innovations in science, technology, engineering, and mathematics learning and teaching (pp. 157-178). Routledge.
Sawyer, R. K. (2003). Group creativity: Music, theater, collaboration. Lawrence Erlbaum Associates.
Scherer, R., Howard, S. K., Tondeur, J., & Siddiq, F. (2021). Profiling teachers' readiness for online teaching and learning in higher education: Who's ready? Computers in Human Behavior, 118, 106675. https://doi.org/10.1016/j.chb.2020.106675
Schmuckler, M. A. (2001). What is ecological validity? A dimensional analysis. Infancy, 2(4), 419-436. https://doi.org/10.1207/S15327078IN0204_02
Schneider, B., & Pea, R. (2013). Real-time mutual gaze perception enhances collaborative learning and collaboration quality. International Journal of Computer-Supported Collaborative Learning, 8(4), 375-397. https://doi.org/10.1007/s11412–013-9181-4
Schwab, K. (2016). The fourth industrial revolution. Crown Business.
Shadish, W. R., Cook, T. D., & Campbell, D. T. (2002). Experimental and quasi-experimental designs for generalized causal inference. Houghton Mifflin.
Siddiq, F., Hatlevik, O. E., Olsen, R. V., Throndsen, I., & Scherer, R. (2016). Taking a future perspective by learning from the past-A systematic review of assessment instruments that aim to measure primary and secondary school students' ICT literacy. Educational Research Review, 19, 58-84. https://doi.org/10.1016/j.edurev.2016.05.002
Siemens, G., & Gašević, D. (2012). Guest editorial-Learning and knowledge analytics. Educational Technology & Society, 15(3), 1-2.
Silseth, K., Steier, R., & Arnseth, H. C. (2024). Exploring students' immersive VR experiences as resources for collaborative meaning making and learning. International Journal of Computer-Supported Collaborative Learning, 19(1), 1-36. https://doi.org/10.1007/s11412–023-09413-0
Simon, H. A. (1996). The sciences of the artificial (3rd ed.). MIT Press.
Smithson, M. (2003). Confidence intervals. SAGE Publications.
So, H. J., & Brush, T. A. (2008). Student perceptions of collaborative learning, social presence and satisfaction in a blended learning environment: Relationships and critical factors. Computers & Education, 51(1), 318-336. https://doi.org/10.1016/j.compedu.2007.05.009
Southgate, E., Grant, S., Ostrowski, S., Norwood, A., Williams, M., & Tafazoli, D. (2022). School students creating a virtual reality learning resource for children. In 2022 IEEE Conference on Virtual Reality and 3D User Interfaces Abstracts and Workshops (VRW) (pp. 261–264). IEEE. https://doi.org/10.1109/VRW55335.2022.00060
Sprangers, M. A. G., & Schwartz, C. E. (1999). Integrating response shift into health-related quality of life research: A theoretical model. Social Science & Medicine, 48(11), 1507-1515. https://doi.org/10.1016/S0277–9536(99)00045-3
Stahl, G. (2006). Group cognition: Computer support for building collaborative knowledge. MIT Press. https://doi.org/10.7551/mitpress/3372.001.0001
Stahl, G., Koschmann, T., & Suthers, D. (2014). Computer-supported collaborative learning. In R. K. Sawyer (Ed.), The Cambridge handbook of the learning sciences (2nd ed., pp. 479-500). Cambridge University Press. https://doi.org/10.1017/cbo9781139519526.029
Stanney, K. M., Mourant, R. R., & Kennedy, R. S. (1998). Human factors issues in virtual environments: A review of the literature. Presence: Teleoperators and Virtual Environments, 7(4), 327-351. https://doi.org/10.1162/105474698565767
Stuart, E. A. (2010). Matching methods for causal inference: A review and a look forward. Statistical Science, 25(1), 1–21. https://doi.org/10.1214/10-STS313
Sullivan, G. M., & Feinn, R. (2012). Using effect size-or why the P value is not enough. Journal of Graduate Medical Education, 4(3), 279-282. https://doi.org/10.4300/JGME-D-12–00156.1
Sun, L., Hu, L., & Zhou, D. (2021). Which way of design programming activities is more effective to promote K-12 students' computational thinking skills? A meta-analysis. Journal of Computer Assisted Learning, 37(4), 1048-1062. https://doi.org/10.1111/jcal.12545
Sung, W., Ahn, J., & Black, J. B. (2016). Introducing computational thinking to young learners: Practicing computational perspectives through embodiment in mathematics education. Technology, Knowledge and Learning, 22(3), 443–463.
Suthers, D., & Verbert, K. (2013). Learning analytics as a "middle space". In Proceedings of the Third International Conference on Learning Analytics and Knowledge (LAK '13) (pp. 1–4). ACM. https://doi.org/10.1145/2460296.2460298
Sweller, J. (1988). Cognitive load during problem solving: Effects on learning. Cognitive Science, 12(2), 257-285.
Sweller, J. (2020). Cognitive load theory and educational technology. Educational Technology Research and Development, 68(1), 1-16. https://doi.org/10.1007/s11423–019-09718-7
Sweller, J., Ayres, P., & Kalyuga, S. (2011). Cognitive load theory. Springer.
Sweller, J., van Merriënboer, J. J. G., & Paas, F. G. W. C. (1998). Cognitive architecture and instructional design. Educational Psychology Review, 10(3), 251-296. https://doi.org/10.1023/A:1022193728205
Sweller, J., van Merriënboer, J. J. G., & Paas, F. (2019). Cognitive architecture and instructional design: 20 years later. Educational Psychology Review, 31(2), 261-292. https://doi.org/10.1007/s10648-019-09465-5
Taber, K. S. (2018). The use of Cronbach's alpha when developing and reporting research instruments in science education. Research in Science Education, 48(6), 1273-1296. https://doi.org/10.1007/s11165-016-9602-4
Tang, K. H. D. (2023). Student-centered approach in teaching and learning: What does it really mean? Acta Pedagogia Asiana, 2(2), 72-83. https://doi.org/10.53623/apga.v2i2.218
Tiernan, P., Costello, E., Donlon, E., Parysz, M., & Scriney, M. (2023). Information and media literacy in the age of AI: Options for the future. Education Sciences, 13(9), 906. https://doi.org/10.3390/educsci13090906
Tondeur, J., Howard, S., Van Zanten, M., Gorissen, P., Van der Neut, I., Uerz, D., & Kral, M. (2023). The HeDiCom framework: Higher Education teachers' digital competencies for the future. Educational Technology Research and Development, 71(1), 33-53. https://doi.org/10.1007/s11423-023-10193-5
Tondeur, J., van Braak, J., Ertmer, P. A., & Ottenbreit-Leftwich, A. (2012). Preparing pre-service teachers to integrate technology in education: A synthesis of qualitative evidence. Computers & Education, 59(1), 134-144. https://doi.org/10.1016/j.compedu.2012.03.009
Tondeur, J., van Braak, J., Ertmer, P. A., & Ottenbreit-Leftwich, A. (2017). Understanding the relationship between teachers' pedagogical beliefs and technology use in education: A systematic review of qualitative evidence. Educational Technology Research and Development, 65(3), 555-575. https://doi.org/10.1007/s11423-017-9506-y
Tracy, S. J. (2010). Qualitative quality: Eight "big-tent" criteria for excellent qualitative research. Qualitative Inquiry, 16(10), 837-851. https://doi.org/10.1177/1077800410381151
Trilling, B., & Fadel, C. (2009). 21st century skills: Learning for life in our times. Jossey-Bass. (A Wiley Imprint)
UNESCO. (2022). ICT competency framework for teachers (Version 3). UNESCO Publishing.
Van Audenhove, L., Vermeire, L., Van den Broeck, W., & Demeulenaere, A. (2024). Data literacy in the new EU DigComp 2.1 framework: How DigComp defines competences on artificial intelligence, internet of things and data. Information and Learning Sciences, 125(5-6), 406-436. https://doi.org/10.1108/ILS-06-2023-0072
van de Pol, J., Volman, M., & Beishuizen, J. (2010). Scaffolding in teacher-student interaction: A decade of research. Educational Psychology Review, 22(3), 271-296. https://doi.org/10.1007/s10648-010-9127-6
Van der Meer, N., van der Werf, V., Brinkman, W. P., & Specht, M. (2023). Virtual reality and collaborative learning: A systematic literature review. Frontiers in Virtual Reality, 4, 1159905. https://doi.org/10.3389/frvir.2023.1159905
Vuorikari, R., Kluzer, S., & Punie, Y. (2022). DigComp 2.2: The digital competence framework for citizens - with new examples of knowledge, skills and attitudes. Publications Office of the European Union. https://doi.org/10.2760/115376
Vuorikari, R., Punie, Y., Carretero, S., & Van den Brande, L. (2016). DigComp 2.0: The Digital Competence Framework for Citizens. Publications Office of the European Union. https://doi.org/10.2791/11517
Vygotsky, L. S. (1978). Mind in society: The development of higher psychological processes. Harvard University Press.
Wang, F., & Hannafin, M. J. (2005). Design-based research and technology-enhanced learning environments. Educational Technology Research and Development, 53(4), 5-23. https://doi.org/10.1007/BF02504682
Wang, X., Yang, J., & Liu, S. (2023). Towards a deeper understanding of students' collaborative learning in immersive virtual environments: A multimodal learning analytics approach [Manuscript submitted for publication].
Wang, X., Yang, J., Cheng, G., & Krajcik, J. (2022). Supporting collaborative science learning in immersive virtual environments: A mutual perspective-taking approach. Computers & Education, 191, 104632. https://doi.org/10.1016/j.compedu.2022.104632
Wang, Z., Ng, J. T. D., & Hu, X. (2024). Learning analytics for collaboration quality assessment during virtual reality content creation. In Proceedings of the 2024 IEEE International Conference on Advanced Learning Technologies (ICALT) (pp. 91-93). IEEE. https://doi.org/10.1109/ICALT61570.2024.00032
Wing, J. M. (2006). Computational thinking. Communications of the ACM, 49(3), 33-35. https://doi.org/10.1145/1118178.1118215
Winne, P. H., & Jamieson-Noel, D. (2002). Exploring students' calibration of self reports about study tactics and achievement. Contemporary Educational Psychology, 27(4), 551–572. https://doi.org/10.1016/S0361-476X(02)00006-1
Wise, A. F., & Schwarz, B. B. (2017). Visions of CSCL: Eight provocations for the future of the field. International Journal of Computer-Supported Collaborative Learning, 12(4), 423-467. https://doi.org/10.1007/s11412-017-9267-5
Wood, D., Bruner, J. S., & Ross, G. (1976). The role of tutoring in problem solving. Journal of Child Psychology and Psychiatry, 17(2), 89-100. https://doi.org/10.1111/j.1469-7610.1976.tb00381.x
World Economic Forum. (2020). The future of jobs report 2020. World Economic Forum.
Worsley, M., & Blikstein, P. (2018). A multimodal analysis of making. International Journal of Artificial Intelligence in Education, 28(3), 385-419. https://doi.org/10.1007/s40593-017-0160-1
Worsley, M., Martinez-Maldonado, R., & D'Angelo, C. (2021). A new era in multimodal learning analytics: Twelve core commitments to ground and grow MMLA. Journal of Learning Analytics, 8(3), 10-27. https://doi.org/10.18608/jla.2021.7530
Yadav, A., Hong, H., & Stephenson, C. (2016). Computational thinking for all: Pedagogical approaches to embedding 21st century problem solving in K-12 classrooms. TechTrends, 60(6), 565-568. https://doi.org/10.1007/s11528-016-0087-7
Yin, R. K. (2018). Case study research and applications: Design and methods (6th ed.). SAGE Publications.
Yin, Y., Hadad, R., Tang, X., & Lin, Q. (2020). Improving and assessing computational thinking in maker activities: The integration with physics and engineering learning. Journal of Science Education and Technology, 29, 189-214. https://doi.org/10.1007/s10956-019-09794-8.
Yu, T., Lin, C., Zhang, S., Wang, C., Ding, X., An, H., Zhang, X., Tang, Y., Huang, J., & Guo, J. (2022). Artificial intelligence for Dunhuang cultural heritage protection: The project and the datas et International Journal of Computer Vision, 130(12), 2957-2972. https://doi.org/10.1007/s11263-022-01665-x
Zhang, L., Agrawal, A., Oney, S., & Guo, A. (2023). VRGit: A version control system for collaborative content creation in virtual reality. In Proceedings of the 2023 CHI Conference on Human Factors in Computing Systems (CHI'23) (pp. 1-14). ACM.https://doi.org/10.1145/3544548.3581136
Zhang, L., Pan, J., Gettig, J., Oney, S., & Guo, A. (2024). VRCopilot: Authoring 3D layouts with generative AI models in VR. In Proceedings of the 37th Annual ACM Symposium on User Interface Software and Technology (UIST'24) (pp. 1-13). ACM.https://doi.org/10.1145/3654777.3676451
Appendix A: Glossary of Key Concepts
This glossary provides standardised definitions for the key constructs of the thesis. The two foundational constructs, Digital Competence and Collaborative VR Creation, are defined with their theoretical lineage, first appearance in the main text, and operationalisation in this study. Shorter entries follow for six working terms used across the chapters.
Digital Competence
Definition.
The confident, critical, and responsible use of digital technologies for learning, at work, and for participation in society (Vuorikari et al., 2022). This definition encompasses five competence dimensions: (1) Information and Data Literacy: the ability to articulate information needs, search for data, and evaluate information credibility; (2) Communication and Collaboration: the capacity to interact, share, and collaborate through digital technologies; (3) Digital Content Creation: the skills to create and edit digital content, including programming and creative production; (4) Safety: the awareness and practice of protecting personal data, privacy, and digital well-being; and (5) Problem Solving: the ability to identify needs and resources, make informed decisions, and solve conceptual and technical problems in digital environments.
Theoretical Source.
The Digital Competence Framework for Citizens (DigComp 2.1), developed by the Joint Research Centre (JRC) of the European Commission (Carretero et al., 2017). The framework operationalises digital competence across five dimensions with 21 sub-competences and eight proficiency levels, providing a common reference for curriculum design, teacher training, and assessment across European Member States. The framework's most recent iteration, DigComp 3.0 (Cosgrove & Cachia, 2025), introduces systematic integration of AI-related competences, including generative AI literacy, across all five dimensions, reflecting the reality that AI-mediated tools have become everyday instruments of digital participation.
First Appearance.
Section 1.1.1, where digital competence is positioned as a foundational citizenship competence in the context of the Fourth Industrial Revolution and examined as the primary learning outcome of collaborative VR creation activities.
Operationalisation in This Study.
Digital competence was operationalised through the five DigComp 2.1 dimensions as follows:
Instrumental Measurement. A 13-item self-assessment instrument, developed from the DigComp 2.1 competence descriptors (Carretero et al., 2017) and validated through expert content review (eight experts; CVR threshold 0.75; overall CVI = 0.85 for the general version and 0.88 for the VR version) and confirmatory factor analysis estimated in semopy 2.0 (Section 3.4.1), was administered at pre-test and post-test across all three intervention cycles.
Behavioural Indicators from CLEVR Platform Logs. Student interactions within the CLEVR platform were logged and mapped to DigComp dimensions: (a) Information and Data Literacy: indexed by search query diversity and source navigation patterns; (b) Communication and Collaboration: indexed by discussion thread frequency and concurrent editing event distributions; (c) Digital Content Creation: indexed by hotspot density (educational design elements per scene), media asset creation counts, and scene assembly completion rates; (d) Safety: indexed by copyright verification clicks and privacy-setting interactions; (e) Problem Solving: indexed by debugging event frequency, scene revision iterations, and error recovery patterns. The full mapping between DigComp dimensions and CLEVR data sources is detailed in Table 13 (Section 3.4.2).
Collaborative VR Creation
Definition.
An educational activity in which students work together to design, build, and share immersive virtual reality experiences, thereby functioning as active digital architects rather than passive consumers of pre-built content. Collaborative VR creation requires learners to plan narrative structures, design spatial interactions, produce multimodal digital artefacts, and negotiate creative decisions with peers, processes that directly engage the full spectrum of digital competences including information literacy, content creation, collaborative problem-solving, and digital safety awareness.
Theoretical Source.
Constructionism, the learning theory originated by Seymour Papert, which posits that learners construct knowledge most effectively when they create external, shareable objects, physical or digital because the act of making renders internal thought processes visible and open to refinement (Papert, 1980; Papert & Harel, 1991). This study also draws on Dillenbourg's (1999) framework for collaborative learning, which provides the theoretical grounding for the social and cognitive dimensions of peer interaction during the creation process. The combination of constructionist making with collaborative learning creates conditions in which students must simultaneously manage individual creative agency and collective negotiation.
First Appearance.
Section 1.1.1, where collaborative VR creation is distinguished from passive VR consumption as the central pedagogical intervention of this study.
Operationalisation in This Study.
Collaborative VR creation was operationalised through the CLEVR (Collaborative Learning Environment for Virtual Reality) platform, developed by the Culture Computing and Multimodal Information Research (CCMIR) laboratory at the University of Hong Kong. The intervention was structured across four creation phases:
Conceptual Design:groups planned narrative themes, allocated roles, and defined spatial layouts for their VR scenes.
Technical Build:students assembled scenes using the CLEVR platform, incorporating multimodal assets (360-degree panoramas, 2D images, audio, text) and designing interactive hotspots.
Iterative Refinement:groups tested their scenes, debugged interactions, and revised content based on peer feedback and aesthetic negotiation.
Presentation and Reflection:completed VR scenes were shared with the class, and students reflected on their creative process and collaborative experience.
Platform Architecture:CLEVR supported concurrent multi-user editing, enabling all group members to simultaneously manipulate objects, upload media, and refine scene elements with real-time synchronisation. The platform recorded comprehensive interaction logs, including timestamps, edit operations, asset selections, discussion posts, and spatial manipulations.
AIGC Integration:the intervention evolved across three Design-Based Research cycles with increasing teacher-mediated asset support. Cycle 1 used manual smartphone capture with no AIGC assets. Cycle 2 introduced teacher-produced asset packages (Nano-Banana 2 for posters and picture books, Skybox AI for 360-degree panoramas, and Jimeng for voiceover narration and sound effects). Cycle 3 extended teacher-mediated production to multimodal assets, adding Kimi for text generation and Jimeng for images and audio; students selected, edited, and integrated these teacher-produced assets rather than generating assets themselves.
Technical Barriers
Definition.
The extraneous cognitive load that unstable tools and complex interfaces create, and that consumes the working memory students need for conceptual learning (Sweller, 1988; Makransky & Petersen, 2021).
First Appearance.
Section 1.1.2.
Teacher-Mediated AIGC Tools
Definition.
An arrangement in which teachers, not students, operate generative AI tools (Nano-Banana 2, Skybox AI, Jimeng, and Kimi) to produce learning assets, which students then select, edit, and combine into their own creations. The arrangement offloads the mechanical work of asset production while keeping students in evaluative and curatorial roles.
First Appearance.
Section 1.1.4.
Safety (DS)
Definition.
The DigComp 2.1 dimension covering the protection of personal data, privacy, and digital well-being, abbreviated as DS in tables and text. The Cycle 2 decline in this dimension was concentrated in the personal-information item (Section 5.5.1).
First Appearance.
Section 3.4.1.
Around Capture
Definition.
The smartphone application used in Cycle 1 for 360-degree panoramic photo capture. Its instability and account requirements were central to the technical barriers observed in that cycle, and it was replaced by teacher-mediated AIGC panoramas in Cycle 2.
First Appearance.
Section 4.3.
Effective Output (EO) and Production-Output Ratio (POR)
Definition.
Effective Output is the count of productive creation actions (Creation/Add, Content Update, and Refinement/Update) recorded in the CLEVR platform logs. The Production-Output Ratio is EO divided by the total number of logged events (POR = EO/Total Events).
First Appearance.
Section 3.5.2.
Recalibration
Definition.
A response-shift process in which participants judge their own competence against a more demanding internal standard after gaining a more sophisticated understanding of the domain (Sprangers & Schwartz, 1999). In this study, recalibration is the leading interpretation of the Cycle 3 decline in collaboration self-assessment (Section 7.1.3).
References
Carretero, S., Vuorikari, R., & Punie, Y. (2017). DigComp 2.1: The Digital Competence Framework for Citizens with Eight Proficiency Levels and Examples of Use. Publications Office of the European Union. https://doi.org/10.2760/38842
Cosgrove, J., & Cachia, R. (2025). DigComp 3.0: European digital competence framework (5th ed.). Publications Office of the European Union.https://doi.org/10.2760/0001149
Dillenbourg, P. (1999). Collaborative learning: Cognitive and computational approaches. Advances in Learning and Instruction Series. Pergamon.
Papert, S. (1980). Mindstorms: Children, computers, and powerful ideas. Basic Books.
Papert, S., & Harel, I. (1991). Constructionism. Ablex Publishing.
Appendix B: Design Decision Log
Cycle 1: Baseline Design and the Emergence of Technical Barriers
Cycle Period. Late September to early October 2025 (two weeks). A week-by-week implementation timeline for all three cycles is given below (Table B.1).
Period | Activity |
|---|---|
Late Sep – early Oct (W1-2) | Cycle 1: pre-test; four 45-minute sessions |
Early Oct (W3) | Cycle 1: post-test (about three weeks after pre-test) |
Mid Oct – mid Nov (W4-6) | Cycle 1 analysis; Cycle 2 redesign and AIGC asset production |
Mid Nov – 12 Dec (W7-10) | Cycle 2: pre-test; four 45-minute sessions (in-class creation session on 12 December); post-test (about four weeks after pre-test) |
Mid to late Dec (W11-12) | Cycle 2 debriefing interviews (three sessions); Cycle 3 redesign |
Late Dec – mid Jan (W13-17) | Cycle 3: pre-test; ten sessions; post-test (about four to five weeks after pre-test) |
Late Jan (W18) | Cycle 3 debriefing interview (one session, six students) |
Table B.1
Implementation Timeline, Autumn Semester 2025
Participant Cohort. N = 41, Grade 7
Group Configuration.8 groups of 5 to 6 students
Platform. Around Capture + 720yun
AIGC Integration. None
Decision C1-D1: Baseline Pedagogical Design
Problem Trigger.
No prior evidence existed on how collaborative VR scene creation would work in K-12 classrooms. The research team needed a foundational cycle to establish whether VR creation activities could develop students' digital competence at all.
Design Hypothesis.
A constructionist approach, where students physically captured 360° photos of their campus and assembled them into VR scenes, would develop students' digital content creation competence, problem-solving, and collaborative skills through hands-on making.
Implementation Action.
• Selected the Around Capture mobile app for 360° photo capture
• Used 720yun as the VR assembly and publishing platform
• Chose campus locations as the thematic focus (familiar, accessible content)
• Ran 4 sessions per group over the intervention period
Observed Result.
• Information and Data Literacy improved significantly (dz = 0.86)
• Communication and Collaboration improved modestly (dz = 0.33)
• Digital Content Creation improved (dz = 0.47)
• Problem Solving showed marginal improvement (dz = 0.26)
• Safety showed no change
• Technical barriers dominated the experience: APK installation consumed entire sessions, poor autofocus frustrated students, and Group 3's collaboration collapsed entirely due to frustration with the capture process
Subsequent Decision.
The mechanical burden of manual photo capture was too high for Grade 7 students. Replace manual capture with AIGC generation in Cycle 2 to absorb technical overhead and shift student effort towards creative and narrative design.
Decision C1-D2: Group Size and Teacher-Assigned Composition
Problem Trigger.
Grade 7 students had limited experience collaborating on technology-intensive group projects. The research team needed to decide how to form groups to promote productive collaboration.
Design Hypothesis.
Teacher-assigned groups would lead to more authentic and equitable collaboration than self-selected groups because teachers could balance skill levels and ensure diverse group composition.
Implementation Action.
• Formed groups of 5 to 6 students each
• Composition was teacher-assigned (not student-selected)
• Groups worked together through all 4 sessions
Observed Result.
• High-cohesion groups (e.g., Group 7) found workarounds for technical problems and maintained productive collaboration
• Low-cohesion groups (e.g., Group 3) collapsed under the combined weight of technical frustration and weak interpersonal dynamics
• The 5 to 6 member size was workable for well-functioning groups but left fragile groups vulnerable to dropout
Subsequent Decision.
Retain teacher-assigned grouping for Cycle 2 but add structured scaffolding (task checklists, clear role assignments, and progress checkpoints) to support groups that lack natural cohesion.
Decision C1-D3: The Collaborative Competence Paradox
Problem Trigger.
Collaboration scores improved (dz = 0.33), but qualitative data revealed a discrepancy: students appeared to coordinate around shared devices, yet there was little evidence of genuine joint problem-solving or shared meaning-making.
Design Hypothesis.
The measured improvement in collaborative competence reflected basic procedural coordination (taking turns, passing the phone) rather than substantive collaborative learning (negotiating ideas, resolving disagreements, building on each other's contributions).
Implementation Action.
• Documented the paradox across all groups
• Planned more nuanced measures of collaboration quality for Cycle 3
• Examined video recordings and interaction logs for evidence of joint engagement
Observed Result.
• Confirmed the hypothesis: students coordinated around shared phones and took turns capturing photos, but most groups did not engage in joint problem-solving or substantive negotiation
• The procedural coordination was sufficient to produce a measurable score increase, but it did not represent deep collaborative learning
• This distinction became critical for interpreting all subsequent collaboration data
Subsequent Decision.
In Cycle 3, design tasks that structurally require genuine negotiation, where students cannot simply divide work and must reach aesthetic consensus to complete the task.
Cycle 2: AIGC Introduction and the Emergence of Communication Challenges
Cycle Period.Middle of the autumn semester 2025, Dongguan
Participant Cohort. N = 130, Grade 7
Group Configuration. Groups of 6 to 8 students
Platform. CLEVR + Skybox AI,Nano-Banana 2, and Jimeng
AIGC Integration.Full integration (Gear City and Pearl Kingdom themed asset packages)
Decision C2-D1: Replacement of Manual Capture with Teacher-Mediated Asset Production
Problem Trigger.
Cycle 1 demonstrated that manual 360° photo capture created severe technical barriers (APK installation, autofocus problems, and phone-sharing bottlenecks) that consumed time and energy better spent on creative design.
Design Hypothesis.
Replacing manual capture with teacher-mediated asset production would absorb the mechanical burden, allowing students to redirect their effort from technical execution towards narrative design, aesthetic decision-making, and content curation.
Implementation Action.
• Selected Skybox AI for 360° panorama generation from text prompts
• Created themed asset packages (Gear City and Pearl Kingdom) to scaffold creative direction
• Transitioned from 720yun to CLEVR as the primary VR creation platform
• Maintained 4-session structure but reallocated time from capture to design
Observed Result.
• Information and Data Literacy improved significantly (dz = 0.49)
• Digital Content Creation improved significantly (dz = 0.24)
• The composite score improved significantly(dz = 0.22, p = .013)
• Communication and Collaboration showed a small, non-significant gain (dz = 0.14, p = .107)
• Problem Solving showed no meaningful change (dz = 0.01, p = .903): students described the workflow as one in which AI handled the hard parts
• Safety declined significantly (dz = −0.20, p = .026), concentrated in the personal-information item
• A new challenge emerged: students struggled to communicate their creative intent to the teacher, who operated the generative tools, and this replaced the old capture bottleneck with a communication bottleneck
Subsequent Decision.
The communication challenges around prompt formulation suggest that collaboration structure needs refinement. Introduce structurally interdependent tasks in Cycle 3 where students must communicate and negotiate to integrate their individual contributions.
Decision C2-D2: Concurrent Co-Editing Platform Architecture
Problem Trigger.
In Cycle 1, sequential collaboration (passing a single phone) created physical bottlenecks where one student worked while others waited, leading to unequal participation and frustration.
Design Hypothesis.
Real-time concurrent editing on a shared platform would create shared ownership of the VR scene, enable equitable participation patterns, and allow multiple students to contribute simultaneously rather than sequentially.
Implementation Action.
• Deployed CLEVR's real-time multi-user editing capability
• All group members could edit the shared VR scene simultaneously from different devices
• Maintained open-ended creative freedom without restricting who could edit what
Observed Result.
• High-performing groups (e.g., Group S29, Gini coefficient = 0.198) achieved balanced participation where members contributed equitably
• Low-performing groups (e.g., Group S01, Gini coefficient = 0.749) experienced coordination challenges: members worked simultaneously but without coordination, leading to conflicting edits and duplicated effort
• The platform solved the physical bottleneck but revealed that concurrent freedom requires coordination skills not all groups possessed
Subsequent Decision.
Concurrent editing is necessary but not sufficient. For Cycle 3, add scaffolding (task checklists, role-based permissions, and structured work phases) to help groups manage concurrent work effectively without sacrificing shared ownership.
Decision C2-D3: Open-Ended Asset Curation Versus Structured Prompt Scaffolding
Problem Trigger.
Students struggled with prompt formulation, that is, translating their creative ideas into text prompts that produced usable 360° panoramas from Skybox AI. This communication barrier consumed time and frustrated students.
Design Hypothesis.
Providing pre-generated themed asset packages (Gear City and Pearl Kingdom) would eliminate the prompt-formulation demand while still giving students meaningful choices in curation and assembly.
Implementation Action.
• Created Gear City asset package with cohesive visual theme
• Created Pearl Kingdom asset package as alternative theme
• Students selected a theme package and curated assets within it, rather than generating panoramas from scratch
• Focus shifted to selecting, arranging, and narrating within a themed collection
Observed Result.
• Eliminated the prompt-formulation barrier entirely
• Students redirected their effort towards curation (selecting which assets to use), spatial arrangement, and narrative design
• The trade-off was a loss of open-ended creative expression: students worked within pre-defined visual themes rather than creating their own
• This trade-off was acceptable at this stage but would need calibration in future cycles
Subsequent Decision.
In Cycle 3, calibrate the balance between open-endedness and structure. Offer more creative freedom than pre-built packages allowed, but provide enough scaffolding that students are not overwhelmed by unlimited options.
Cycle 3: Multimodal Integration and the Emergence of Self-Assessment Changes
Cycle Period.Late in the autumn semester 2025, Dongguan
Participant Cohort. N = 47, high-achieving science-track students
Group Configuration.Groups of 5 to 6 students
Platform.CLEVR with Kimi + Jimeng
AIGC Integration.Multimodal (panorama + audio + text generation)
Decision C3-D1: Multimodal Asset Integration Task with Hub-and-Spoke Architecture
Problem Trigger.
Cycle 2 collaboration was largely superficial: students adopted a "divide and conquer" approach where each member worked on a separate part without genuine negotiation or integration. Qualitative data showed little evidence of joint decision-making.
Design Hypothesis.
A structurally interdependent task design would force genuine collaboration. Specifically, a hub-and-spoke architecture, where each student creates a themed "spoke" scene that must visually and thematically connect to a shared central "hub" scene, would create aesthetic interdependencies that require students to negotiate and reach consensus.
Implementation Action.
• Designed a hub-and-spoke architecture: one central hub scene surrounded by 5 radiating themed spoke scenes
• Students worked on the spoke scenes in pairs or trios, with three to four spokes per group of five to six members (see Appendix B).
• Each spoke required multimodal integration: teacher-mediated panorama (Skybox AI), background audio (Jimeng), and explanatory text (Kimi)
• Spoke scenes had to connect thematically and visually to the central hub, creating structural interdependence
Observed Result.
• Initial phase involved chaos: file-naming conflicts, aesthetic disagreements about how spokes should relate to the hub, and uncertainty about who had authority to make decisions
• Over time, most groups self-organised governance rules (turn-taking, voting, designated coordinators)
• Sustained collaboration emerged for most groups as they worked through the interdependencies
• The structural requirement of aesthetic consensus drove genuine negotiation that had been absent in Cycle 2
Subsequent Decision.
The pattern of initial chaos followed by self-organised governance appears promising. Confirm the pattern across groups, document the emergent governance strategies, and refine scaffolding to reduce initial friction without removing the interdependence that drives collaboration.
Decision C3-D2: Focused Sample Selection (Science and Technology Track)
Problem Trigger.
Cycle 2 produced significant gains in two dimensions with a general Grade 7 sample. The research team needed to test whether the design worked for different student populations, specifically, whether high-achieving students with strong STEM backgrounds would show a different competence trajectory.
Design Hypothesis.
High-achieving science-track students would enter the intervention with higher baseline digital competence and might show different patterns of gain, particularly in areas requiring analytical problem-solving and structured collaboration.
Implementation Action.
• Purposively selected students from the science and technology academic track (N = 47)
• Maintained the same hub-and-spoke multimodal task design as the general cohort
• Preserved all measurement instruments and procedures for cross-cycle comparison
Observed Result.
• Confirmed high baseline competence as expected
• No dimension showed a statistically significant gain: IDL (dz = 0.22, p = .141), DCC (dz = 0.15, p = .315), Problem Solving (dz = 0.12, p = .397), and Safety (dz = −0.12, p = .420) all remained flat, and the composite score was unchanged (dz = −0.09, p = .545)
• The source-evaluation item (IDL2) improved significantly (dz = 0.35, p = .020), replicating the cross-cycle trend
• Communication and Collaboration self-assessment declined significantly (dz = −0.56, p < .001), but qualitative data suggested this reflected self-assessment recalibration rather than actual skill loss: high-achieving students raised their standards for what counts as "good collaboration" after experiencing the demanding hub-and-spoke task
• This self-assessment recalibration phenomenon was distinct from the collaborative patterns seen in Cycle 2
Subsequent Decision.
Consider testing the refined design with more diverse student populations in future research, including general-track students and different grade levels, to establish broader applicability.
Decision C3-D3: Hub-and-Spoke Methodological Adjustment
Problem Trigger.
The original hub-and-spoke design required 5 spoke scenes per group, each with multimodal assets (panorama, audio, text). In practice, this proved too demanding within the available session time: groups rushed or failed to complete all spokes with adequate quality.
Design Hypothesis.
Reducing the spoke count from 5 to a flexible 3 to 4, allocated based on group size and observed capacity, would improve completion rates while preserving the structural interdependence that drives collaboration.
Implementation Action.
• Adjusted the design to allow flexible spoke allocation based on group size and observed capacity
• Groups of 5 to 6 students were assigned 3 to 4 spokes rather than 5
• Teachers assessed each group's progress after the first session and adjusted spoke count accordingly
• The hub scene and aesthetic consensus requirement remained unchanged
Observed Result.
• Completion rate improved substantially compared to initial 5-spoke expectations
• Most groups produced coherent multimodal VR scenes where spokes connected meaningfully to the hub
• Students reported less time pressure and more opportunity for quality work
• The structural interdependence was preserved because fewer spokes still required the same aesthetic consensus
Subsequent Decision.
Document this flexible-spoke adjustment as a design principle: the number of interdependent elements should scale to group capacity rather than being fixed. Apply this principle in future iterations and report it as a refined design feature.
Appendix C: Codebook for Qualitative Analysis
Speaker IDs follow the format T{focus group}_{speaker number}; the transcripts use the hyphenated form (e.g., T1-1). Focus groups T1 to T3 were held after Cycle 2 (five students each, organised by story theme: Gear City, Pearl Kingdom, and a mixed group). Short IDs inside quotations (e.g., "T5") refer to a member of the speaker's own group, not to a focus-group speaker.
Purpose and Overview
This codebook documents the coding scheme used for the qualitative analysis of student focus group transcripts in a design-based research (DBR) study on collaborative VR world-building. The study employed a three-cycle DBR design, with Cycle 1 establishing a baseline, Cycle 2 identifying core challenges, and Cycle 3 evaluating refinements. This codebookcovers the focus group transcripts from Cycle 2 (three groups, 15 students). The Cycle 3 debriefing was not transcribed.
The analytical approach follows a hybrid deductive-inductive thematic analysis (Braun & Clarke, 2006; Fereday & Muir-Cochrane, 2006). Tier 1 codes are researcher-identified,phenomenon-centred categories derived from the core challenges observed in student interactions. Tier 2 codes are inductively generated from unexpected patterns that emerged during analysis.
Tier 1: Core Challenge Codes (Deductive-Phenomenon-Centred)
Table C.1
Technical Barriers (TD)
Field | Content |
|---|---|
Definition | Any utterance describing challenges arising from software interfaces, hardware limitations, tool complexity, or prompt-engineering difficulties. Covers app crashes, installation problems, navigation confusion, AI miscomprehension. |
Inclusion Criteria | 1. Explicit mention of tool malfunction, software crash, or interface confusion |
Exclusion Criteria | 1. General complaints about task difficulty (code as TCC) |
Sub-codes | TD-Hardware: Physical device issues |
Frequency | Cycle 2: 23 instances; Cycle 3: 4 (field notes; mostly TD-Resolved) |
Note.The code label TD is retained from the original codebook for continuity with the coded transcripts; the construct is referred to as technical barriers throughout the thesis.
Example Quotations (Cycle 2):
"It was too hard to get the right picture! We typed the prompt many times, but the AI kept giving us images with weird angles or wrong colours. We couldn't use them directly."- Student T1_4
"I only knew 'upload' and 'save', and guessed the rest. I was terrified that pressing the wrong button would delete the whole scene."- Student T1_3
Table C.2
Team Coordination Challenges (TCC)
Field | Content |
|---|---|
Definition | Any utterance describing teamwork difficulties - role ambiguity, unequal participation, conflicting edits, task division disputes, or group-level overwhelm. |
Inclusion Criteria | 1. Descriptions of group collapse or severe disengagement |
Exclusion Criteria | 1. Individual-level tool complaints (code as TD) |
Sub-codes | TCC-Chaos: Multiple simultaneous challenges producing overwhelm |
Frequency | Cycle 2: 14 instances; Cycle 3: 9 (field notes; mostly TCC-Governance and TCC-Recovery) |
Example Quotations (Cycle 2):
"The teacher had to help us rewrite the prompts again and again. The AI pictures looked good only after the teacher fixed our words."- Student T1_3
Table C.3
Student Engagement (SE)
Field | Content |
|---|---|
Definition | Any utterance describing sustained involvement, positive emotional responses, creative satisfaction, or collective achievement during VR creation. Includes absorption, enjoyment, creative pride, team synchronisation. |
Theoretical Note | This study treats engagement as a descriptive category for student task involvement. It does not claim to measure psychometrically validated “flow states.” |
Inclusion Criteria | 1. Expressions of deep enjoyment, excitement, or satisfaction |
Exclusion Criteria | 1. General liking without absorption descriptors |
Sub-codes | SE-Individual: Individual absorption and creative satisfaction SE-Collective: Team synchronisation and shared achievement |
Frequency | Cycle 2: 31 instances; Cycle 3: 15 (field notes) |
Example Quotations (Cycle 2):
"You just type a few words, and 'whoosh', the Steel City appears! It felt very sci-fi, with a cyberpunk vibe."- Student T1_3
"I thought the background music was just okay at first. But when I put on the headphones and VR glasses... it really felt like being underwater. The sound was muffled and very real." - Student T2_1
"The best part was that everyone could throw things in! Before, when making PPTs, we always fought for the mouse. This time, we didn't have to."- Student T3_2
"It felt like playing a video game together." - Student T1_1
Tier 2: Emergent Inductive Codes
Table C.4
AI-Related Ethical Awareness (AI-Ethics)
Field | Content |
|---|---|
Emergence | Cycle 2; unexpected Digital Safety decline |
Definition | Student attitudes towards copyright, attribution, AI authorship, digital risk. |
Inclusion Criteria | 1. References to image ownership or creator attribution2. Expressions of concern about digital safety or data privacy3. Reflections on the nature of AI-generated content vs. human-made content |
Exclusion Criteria | 1. General complaints about AI quality (code as TD-AIGC)2. Technical discussion of AI operation (code as TD-AIGC) |
Frequency | Cycle 2: 7 instances; Cycle 3: 3 (field notes) |
Example Quotations (Cycle 2):
"We just used the AI pictures. We didn't really think about who made them first."- Student T2_3
Table C.5
Scaffold Request (Scaffold-Req)
Field | Content |
|---|---|
Emergence | Cycle 2; student-proposed improvements |
Definition | Explicit requests for pedagogical or technological scaffolding to support collaborative VR creation. |
Inclusion Criteria | 1. Direct proposals for workflow tools or procedural aids |
Exclusion Criteria | 1. Implicit needs expressed only through complaint (code as TD or TCC) |
Sub-codes | Scaffold-Workflow: Task checklists, progress tracking, procedural tools |
Frequency | Cycle 2: 11 instances; Cycle 3: 2 (field notes) |
Example Quotations (Cycle 2):
"We need a task checklist to track progress."- T2_5
"Can we have an 'anti-prank' feature? Or let the group leader have deletion permissions only?"- T3_5
"I want to train my own AI model."- T1_5
Table C.6
Empathy-Driven Design (Empathy-Design)
Field | Content |
|---|---|
Emergence | Cycle 3; “lost tourist” navigation failure |
Definition | Perspective shift from task-completion orientation to user-centred design thinking. Captures moments when students considered end-user experience rather than merely finishing assigned tasks. |
Inclusion Criteria | 1. Descriptions of experiencing the VR world from a visitor's perspective |
Exclusion Criteria | 1. Technical bug reports without user perspective (code as TD) |
Frequency | Cycle 3: 6 (field notes); not present in Cycle 2 |
Table C.7
Tool Adaptation Strategy (Tool-Adapt)
Field | Content |
|---|---|
Emergence | Cycle 2 and Cycle 3 |
Definition | Student-developed workarounds, efficiency strategies, and signs of progressive tool mastery. Captures evidence of learning-through-doing and collaborative problem-solving that leads to improved technical fluency. |
Inclusion Criteria | 1. Descriptions of improvised solutions to technical limitations2. Accounts of strategy development through trial and error3. Evidence of shifting self-evaluative standards regarding collaboration quality4. Descriptions of role specialisation or coordinated action to overcome tool limits |
Exclusion Criteria | 1. Unresolved technical complaints (code as TD)2. Teacher-provided solutions without student adaptation |
Frequency | Cycle 2: 8 instances; Cycle 3: 3 (field notes) |
Example Quotations:
Coding Rules and Procedural Protocols
Software
NVivo 14 (QSR International)
Data Source
Focus group transcripts from: - Cycle 2: Three focus groups (N = 15 students, 5 per group) - Cycle 3: One debriefing session (N = 6 students; field notes, not transcribed)Analytical Approach
Hybrid deductive-inductive thematic analysis (Braun & Clarke, 2006; Fereday & Muir-Cochrane, 2006). Tier 1 codes were developed a priori from observed challenge phenomena; Tier 2 codes were generated inductively from emergent patterns.
Coder Configuration
•Coder A:Lead researcher
•Coder B: Bilingual research assistant
•Both coders completed training on the codebook definitions and independently coded 20% of transcripts before full coding.
•Discrepancies were resolved through discussion.
Inter-Rater Reliability Procedure
Independent analysis of 20% randomly selected transcripts. Inter-rater agreement reached Cohen's kappa of 0.80 (substantial agreement per Landis & Koch, 1977).
Application Rules
1.Mutual exclusivity:Each utterance receives one primary code. Where multiple codes could apply, coders select the code that best captures the primary phenomenon described.
2.Sub-code assignment:All coded utterances in Tier 1 must receive a sub-code. Tier 2 codes use sub-codes only where applicable.
3.Contextual sensitivity:Coders consider surrounding conversational context (minimum 3 utterances before and after) when assigning codes.
4.Student voice preservation:All direct quotations come from the transcribed Cycle 2 interviews; Cycle 3 material is drawn from field notes and is marked as such.
5.Cycle attribution: Each coded instance is tagged with Cycle 2 or Cycle 3 identifier to enable longitudinal comparison.
Appendix D: Statistical and Psychometric Output
D.1 Instrument Validation Summary
D.1.1 Content Validity
A panel of eight experts, including educational psychologists, digital education scholars, and K-12 teachers with VR teaching experience, rated all 26 candidate items (13 pre-test and 13 post-test) on relevance, clarity, and contextual appropriateness using a 5-point scale. Item-level Content Validity Ratios were computed as CVR = (ne − N/2)/(N/2), where ne is the number of experts rating an item as essential (a score of 4 or 5) and N is the total number of experts (Lawshe, 1975). For a panel of eight experts, the minimum acceptable CVR is 0.75. The overall Content Validity Index (CVI) reached 0.85 for the general (pre-test) version and 0.88 for the VR-contextualised (post-test) version, both above the 0.80 criterion for excellent content validity (Polit & Beck, 2006). No items were deleted; three items were revised based on expert feedback, including one Problem Solving item whose wording was clarified for the VR context. Experts also suggested integrating familiar Chinese digital tools, such as Douyin, into the content-creation items, and these suggestions were incorporated. The full item-level ratings are archived with the expert scoring sheets.
D.1.2 Item Descriptives and Corrected Item-Total Correlations (Cycle 2 Sample, N = 130)
Item | Content (abbreviated) | Pre M (SD) | Post M (SD) | CITC (pre) | CITC (post) |
|---|---|---|---|---|---|
IDL1 | Search engines for study materials | 3.84 (1.02) | 3.88 (1.09) | .51 | .43 |
IDL2 | Evaluating website reliability | 3.48 (1.03) | 4.17 (0.93) | .44 | .47 |
CC1 | Instant messaging for coordination | 4.28 (1.00) | 4.32 (0.90) | .46 | .50 |
CC2 | Online collaborative task completion | 3.45 (1.14) | 3.85 (1.00) | .55 | .53 |
DCC1 | Creating with multiple media types | 3.82 (0.98) | 4.08 (0.89) | .55 | .47 |
DCC2 | Copyright awareness in creation | 3.95 (1.20) | 4.15 (1.05) | .63 | .59 |
DS1 | Password composition | 4.31 (1.06) | 4.32 (0.95) | .38 | .37 |
DS2 | Protecting personal information | 4.62 (0.75) | 4.40 (0.93) | .44 | .39 |
PS1 | Solving problems independently | 3.88 (1.07) | 3.89 (1.08) | .49 | .50 |
PS2 | Learning new tools through tutorials | 4.02 (0.97) | 4.15 (0.99) | .65 | .72 |
PS3 | Choosing appropriate digital tools | 3.97 (0.97) | 3.92 (0.96) | .63 | .59 |
DC1 | Publishing work to online communities | 3.62 (1.28) | 3.68 (1.14) | .48 | .49 |
DC2 | Cautious and civil online communication | 4.59 (0.82) | 4.50 (0.76) | .52 | .52 |
Note. CITC = corrected item-total correlation. All CITC values exceed the 0.30 criterion, so all 13 items were retained. DC1 and DC2 are scored within the Communication and Collaboration dimension.
D.1.3 Internal Consistency Reliability
Dimension | Items | α (pre-test) | α (post-test) |
|---|---|---|---|
Information & Data Literacy | 2 | .50 | .37 |
Communication & Collaboration | 4 | .65 | .59 |
Digital Content Creation | 2 | .55 | .68 |
Safety | 2 | .69 | .56 |
Problem Solving | 3 | .70 | .76 |
Overall scale | 13 | .854 | .849 |
Note. The overall scale shows good internal consistency at both waves. Subscale coefficients are attenuated by the small number of items per subscale and should be interpreted alongside the item-total correlations in D.1.2.
D.2 Structural Validity
D.2.1 Exploratory Factor Analysis
An exploratory factor analysis was conducted on the 13 items with principal axis factoring and promax rotation (pilot sample, N = 25). Sampling adequacy was marginal (KMO = .65). Five factors were extracted, accounting for 67.8% of total variance, but the rotated solution did not yield a clean simple structure: several items loaded on more than one factor, and the factors were moderately to strongly intercorrelated. Given the small pilot sample, these results were treated as indicative only, and the structure was tested formally with the larger Cycle 2 sample (D.2.2).
D.2.2 Confirmatory Factor Analysis
Model specification.A five-factor correlated model was estimated with maximum likelihood in semopy 2.0 (Python), using Cycle 2 post-test data (N = 130). The 13 observed items were specified to load only on their hypothesised factors (IDL: IDL1-IDL2; CC: CC1, CC2, DC1, DC2; DCC: DCC1-DCC2; DS: DS1-DS2; PS: PS1-PS3), and all factors were permitted to covary.
Model fit.Model fit was mixed: χ²(55) = 89.66, p = .002, CFI = .926, TLI = .895, RMSEA = .070, SRMR = .106. The five-factor model fitted significantly better than a one-factor model (one-factor: χ²(65) = 144.5, CFI = .831, RMSEA = .097; Δχ²(10) = 54.8, p < .001), supporting the multi-dimensional interpretation.
Standardised factor loadings.All 13 loadings were statistically significant (all p < .001):
Factor | Item | Loading | Factor | Item | Loading |
|---|---|---|---|---|---|
IDL | IDL1 | .458 | DS | DS1 | .551 |
IDL | IDL2 | .494 | DS | DS2 | .713 |
CC | CC1 | .473 | PS | PS1 | .630 |
CC | CC2 | .566 | PS | PS2 | .890 |
CC | DC1 | .456 | PS | PS3 | .650 |
CC | DC2 | .554 | DCC | DCC1 | .659 |
DCC | DCC2 | .786 |
Factor correlations. Inter-factor correlations were high: IDL-CC = 1.26 (an unstable, out-of-bounds estimate that further signals poor separability), IDL-DCC = .94, IDL-PS = .91, CC-DCC = .93, CC-PS = .87, CC-DS = .80, DCC-PS = .73, DS-PS = .54, DS-IDL = .46, DS-DCC = .28. These values indicate that the five dimensions are related but not fully separable empirically in this sample.
Convergent and discriminant validity.
Dimension | AVE | CR |
|---|---|---|
IDL | .23 | .37 |
CC | .27 | .59 |
DCC | .53 | .69 |
DS | .41 | .57 |
PS | .54 | .77 |
Note. AVE = Average Variance Extracted; CR = Composite Reliability. Three of five dimensions have AVE below .50 and four have CR below .70.
Interpretation.The five-factor structure fits better than a one-factor model, but absolute fit is partial and discriminant validity is limited: the IDL-CC correlation of 1.26 is a Heywood case. The instrument is therefore used as a 13-item composite measure with content-valid subscales, and dimension-level results are treated as exploratory (Section 3.4.1).
D.3 Cycle 1 Inferential Statistics (N = 41)
Dimension | Pre M (SD) | Post M (SD) | t(40) | p | dz [95% CI] |
|---|---|---|---|---|---|
IDL | 3.74 (0.81) | 4.34 (0.75) | 5.54 | <.001 | 0.86 [0.55, 1.17] |
CC | 4.16 (0.75) | 4.37 (0.74) | 2.13 | .039 | 0.33 [0.02, 0.64] |
DCC | 4.01 (0.81) | 4.67 (0.69) | 3.01 | .005 | 0.47 [0.15, 0.79] |
DS | 4.01 (0.90) | 4.22 (0.62) | 0.59 | .562 | 0.09 [−0.22, 0.40] |
PS | 4.10 (0.90) | 4.37 (0.50) | 1.69 | .099 | 0.26 [−0.05, 0.57] |
Note. With N = 41 matched pairs, the minimum detectable dz at 80% power (alpha = .05, two-tailed) is approximately 0.44; smaller true effects cannot be detected reliably in Cycle 1. Computed in G*Power (Faul et al., 2009).
D.4 Cycle 2 Inferential Statistics (N = 12 7 matched pairs)
D.4.1 Dimension-Level Results
Dimension | Pre M (SD) | Post M (SD) | t(126) | p | dz [95% CI] | Wilcoxon p |
|---|---|---|---|---|---|---|
IDL | 3.67 (0.83) | 4.04 (0.78) | 5.58 | <.001 | 0.49 [0.32, 0.67] | <.001 |
CC | 4.01 (0.73) | 4.09 (0.65) | 1.62 | .107 | 0.14 [−0.03, 0.32] | .121 |
DCC | 3.91 (0.89) | 4.12 (0.85) | 2.71 | .008 | 0.24 [0.07, 0.42] | .002 |
DS | 4.49 (0.77) | 4.36 (0.79) | −2.26 | .026 | −0.20 [−0.38, −0.02] | .041 |
PS | 3.98 (0.76) | 3.99 (0.83) | 0.12 | .903 | 0.01 [−0.16, 0.19] | .723 |
Composite | 4.01 (0.59) | 4.11 (0.58) | 2.52 | .013 | 0.22 [0.05, 0.40] | .005 |
D.4.2 Item-Level Results
Item | Pre M | Post M | t(126) | p | dz |
|---|---|---|---|---|---|
IDL1 | 3.83 | 3.91 | 0.88 | .379 | +0.08 |
IDL2 | 3.50 | 4.17 | 6.69 | <.001 | +0.59 |
CC1 | 4.31 | 4.33 | 0.27 | .785 | +0.02 |
CC2 | 3.47 | 3.85 | 3.73 | <.001 | +0.33 |
DCC1 | 3.84 | 4.08 | 2.45 | .016 | +0.22 |
DCC2 | 3.98 | 4.16 | 1.99 | .049 | +0.18 |
DS1 | 4.34 | 4.32 | −0.20 | .845 | −0.02 |
DS2 | 4.65 | 4.40 | −3.30 | .001 | −0.29 |
PS1 | 3.91 | 3.91 | −0.08 | .937 | −0.01 |
PS2 | 4.04 | 4.14 | 1.17 | .243 | +0.10 |
PS3 | 4.00 | 3.93 | −0.85 | .395 | −0.08 |
DC1 | 3.61 | 3.67 | 0.59 | .555 | +0.05 |
DC2 | 4.63 | 4.50 | −2.02 | .045 | −0.18 |
Note. The IDL gain is concentrated in the source-evaluation item (IDL2); the DS decline is concentrated in the personal-information item (DS2); the collaborative-work item (CC2) improved while the cautious-communication item (DC2) declined.
D.4.3 Assumption Checks
Shapiro-Wilk tests indicated non-normal difference scores for all dimensions (all p < .001), as expected for Likert-type difference scores. Wilcoxon signed-rank tests were therefore computed as sensitivity checks and confirmed every t-test conclusion (D.4.1, rightmost column). With N = 12 7 matched pairs, the minimum detectable dz at 80% power is approximately 0.25.
Fifteen post-test records showed zero response variance. All dimension-level conclusions are unchanged when these records are excluded; the composite gain becomes marginal (p = .060) and is therefore interpreted with caution.
D.5 Cycle 3 Inferential Statistics (N = 47 matched pairs)
D.5.1 Dimension-Level Results
Dimension | Pre M (SD) | Post M (SD) | t(46) | p | dz [95% CI] | Wilcoxon p |
|---|---|---|---|---|---|---|
IDL | 4.11 (0.68) | 4.20 (0.65) | 1.50 | .141 | 0.22 [−0.08, 0.52] | .134 |
CC | 4.49 (0.51) | 4.29 (0.54) | −3.85 | <.001 | −0.56 [−0.85, −0.27] | <.001 |
DCC | 4.17 (0.60) | 4.26 (0.67) | 1.02 | .315 | 0.15 [−0.15, 0.45] | .344 |
DS | 4.57 (0.53) | 4.53 (0.57) | −0.81 | .420 | −0.12 [−0.42, 0.18] | .405 |
PS | 4.29 (0.71) | 4.36 (0.55) | 0.86 | .397 | 0.12 [−0.16, 0.40] | .439 |
Composite | 4.35 (0.51) | 4.32 (0.52) | −0.61 | .545 | −0.09 [−0.39, 0.21] | — |
D.5.2 Item-Level Results (Selected)
Item | Pre M | Post M | t(46) | p | dz |
|---|---|---|---|---|---|
IDL2 (source evaluation) | 3.98 | 4.21 | 2.41 | .020 | +0.35 |
CC1 (instant-messaging coordination) | 4.57 | 4.19 | −3.88 | <.001 | −0.57 |
CC2 (online collaborative work) | 4.47 | 4.23 | −2.30 | .026 | −0.34 |
DC2 (cautious communication) | 4.70 | 4.45 | −3.07 | .004 | −0.45 |
DC1 (publishing/sharing) | 4.21 | 4.28 | 0.62 | .537 | +0.09 |
PS1 (independent problem-solving) | 4.23 | 4.38 | 1.36 | .181 | +0.20 |
Note. Full item-level statistics are available from the researcher upon request. The CC decline is broad-based across three of the four CC items.
D.5.3 Assumption Checks
Shapiro-Wilk tests indicated non-normal difference scores (all p < .01). Wilcoxon signed-rank tests confirmed all dimension-level t-test conclusions (D.5.1, rightmost column); the CC decline is robust to the non-parametric check (p < .001). With N = 47 matched pairs, the minimum detectable dz at 80% power is approximately 0.41. The observed CC decline (dz = −0.56) exceeds this threshold.
D.6 Cross-Cycle Analyses
D.6.1 Baseline Comparisons (Cycle 2 vs. Cycle 3, Independent-Samples t-tests)
Dimension | C2 Pre M (SD) | C3 Pre M (SD) | t(175) | p | d |
|---|---|---|---|---|---|
IDL | 3.66 (0.84) | 4.11 (0.68) | 3.28 | .001 | +0.56 |
CC | 3.99 (0.75) | 4.49 (0.51) | 4.25 | <.001 | +0.72 |
DCC | 3.88 (0.91) | 4.17 (0.60) | 2.00 | .047 | +0.34 |
DS | 4.46 (0.80) | 4.57 (0.53) | 0.90 | .370 | +0.15 |
PS | 3.96 (0.80) | 4.29 (0.71) | 2.53 | .012 | +0.43 |
Note. Cycle 2: N = 130; Cycle 3: N = 47. d = standardised mean difference (positive = higher in Cycle 3). Cycle 3 students scored significantly higher on four of five dimensions, confirming the expected selection difference.
D.6.2 Propensity Score Matching
Procedure.Each Cycle 3 participant was matched with a Cycle 2 student on pre-test total score and gender, using nearest-neighbour matching without replacement with a caliper of 0.2 SD of the pooled pre-test total score (Stuart, 2010). Forty-five of 47 Cycle 3 students were matched.
Balance diagnostics.The standardised mean difference (SMD) in pre-test total score fell from 0.59 before matching to 0.01 after matching, indicating excellent balance.
Matched comparison of gains.
Dimension | C3 gain (n = 45) | C2 matched gain (n = 45) | t(88) | p |
|---|---|---|---|---|
IDL | +0.09 | +0.11 | −0.20 | .844 |
CC | −0.20 | −0.04 | −1.91 | .059 |
DCC | +0.09 | +0.17 | −0.54 | .591 |
DS | −0.04 | −0.13 | +0.90 | .368 |
PS | +0.07 | 0.00 | +0.49 | .626 |
Note. The CC decline in Cycle 3 was larger than that of Cycle 2 students matched on pre-test score and gender, a trend consistent with task complexity contributing to the decline, though not statistically decisive (p = .059). PSM cannot adjust for unmeasured selection variables (Rosenbaum, 2002).
D.7 Analytical Notes
Software.Descriptive statistics and paired-samples t-tests were computed in SPSS 27.0 (IBM Corp., 2020). The confirmatory factor analysis was estimated in semopy 2.0 (Python). PSM was implemented in Python following Stuart (2010).
Effect size convention.Cohen's dz for paired designs (Lakens, 2013) is reported throughout, with 95% confidence intervals.
Multiplicity policy.Significance was evaluated at the per-comparison α = .05 with exact p values and effect sizes reported; no family-wise adjustment was applied, in line with the exploratory, pattern-oriented logic of DBR (Section 3.5.1). 95% CIs for dz were computed as dz ± t(.975, df) × SE (SE = dz/t).
Data availability.The de-identified item-level datasets (Cycle 2: N = 130; Cycle 3: N = 47) and the analysis scripts are archived with the research team and are available on request, subject to the ethics approval conditions (Reference: EAE25015).
Appendix E: Curriculum Materials
This appendix provides a complete catalogue of the curriculum materials used across the three DBR cycles. Materials are organised by cycle, with each entry describing its purpose, format, and distribution method. Where materials were generated using artificial intelligence tools, the specific tool and prompt strategy are noted. Sample images and templates are described in text where reproduction in this appendix is not feasible.
E.1 Cycle 1: Baseline Intervention Materials
E.1.1 Outdoor Panoramic Capture Task Sheet
Purpose. To guide students through the process of capturing 360-degree panoramic images using the Around mobile application. The task sheet was distributed at the beginning of Session 2.
• Equipment:Students used their own smartphones, which the school held centrally and issued for the outdoor sessions, with the Around Capture app pre-installed.
• Capture locations: A designated outdoor area within the school campus, selected for visual diversity (buildings, greenery, open spaces).
• Technical requirements: Students were instructed to hold the phone vertically, rotate slowly at a constant speed, and maintain level orientation throughout the capture. The task sheet included a diagram showing correct and incorrect capture postures.
• Quality criteria: Images must be free of motion blur, stitching errors, and exposure inconsistencies. A checklist on the reverse side allowed students to self-assess their captures before uploading.
The task sheet is reproduced verbatim. In actual implementation, students used their own smartphones, which the school issued before the session and collected back afterwards (Section 3.3.5).
Figure E-1
A step-by-step capture instructionswith posture diagrams and camera setting
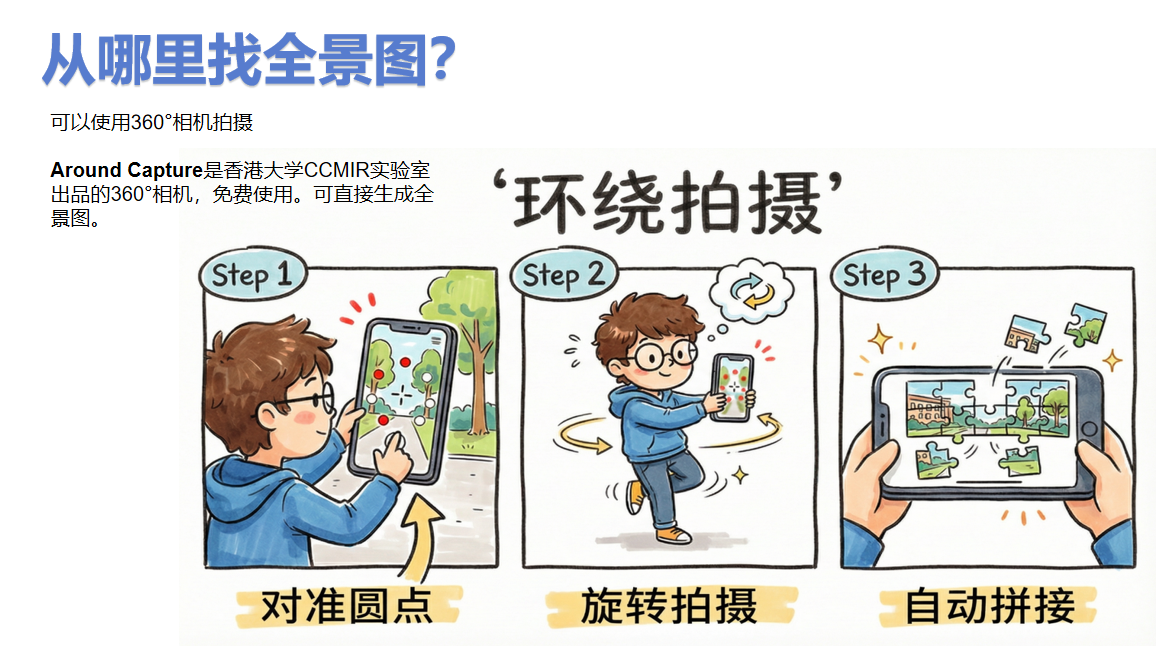
E.1.2 720yun Platform Operation Guide
To provide step-by-step instructions for uploading panoramic images to the 720yun platform and placing interactive hotspots. The guide was distributed at the beginning of Session 3.
Figure E-2
The Importance of Navigation
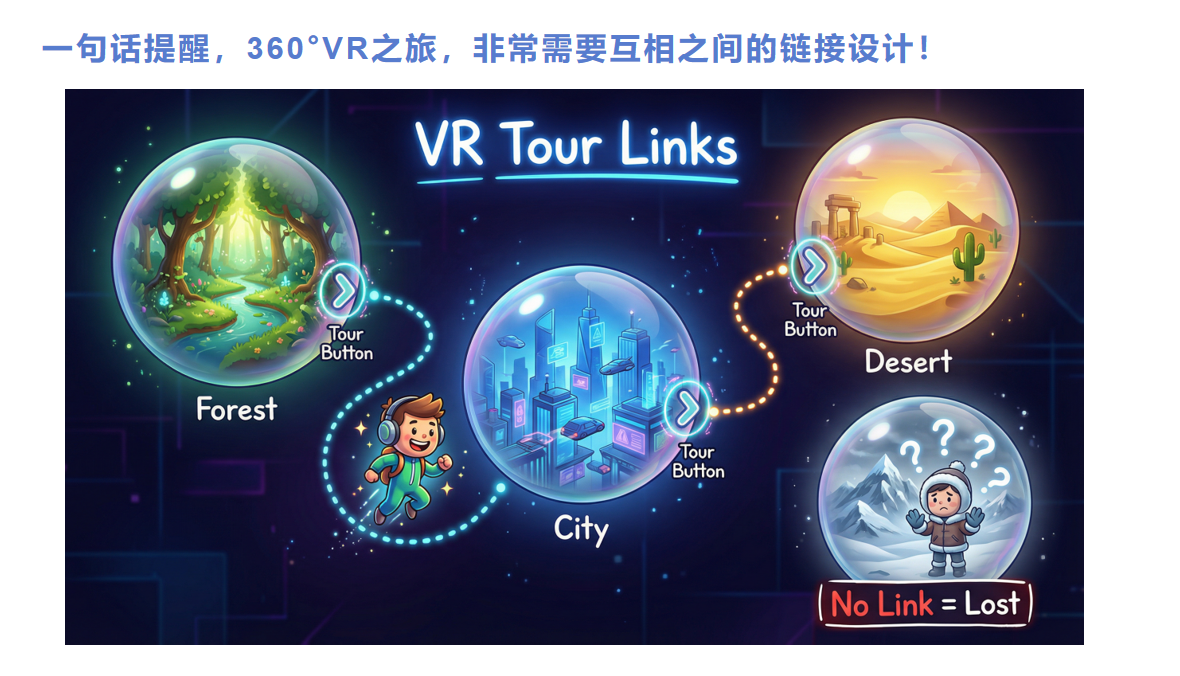
• Login procedures:Teacher-managed 720yun accounts.
• Upload workflow: Selecting the panoramic image, setting the scene title, and confirming upload.
• Hotspot placement: Navigating to the target location within the 360-degree view, clicking to place the hotspot, entering the destination scene, and configuring the jump button text.
• Troubleshooting: Common errors and their solutions (e.g., file size limits, unsupported formats, network timeout).
E.1.3 VR Story Assembly Checklist
Purpose. To support self-monitoring and progress tracking during Sessions 3-4. Students ticked items as they completed each assembly step.
• Scene upload (all 6 panoramas uploaded to 720yun).
• Navigation links (all scenes connected with bidirectional hotspots).
• Scene titles (each scene has a descriptive title in English).
• Presentation readiness (group can navigate the complete VR story without errors).
E.2 Cycle 2: Teacher-Mediated AIGC Intervention Materials
E.2.1 Theme Selection Guide
Purpose. To introduce students to the two fantasy world themes (Gear City and Pearl Kingdom) and guide their selection process. Distributed at the beginning of Session 1.
• World overview: A one-page narrative description of each world, including setting, atmosphere, key locations, and cultural references.
• Visual preview: A theme poster and sample panoramic image for each world.
Figure E-3
How Panoramic images work
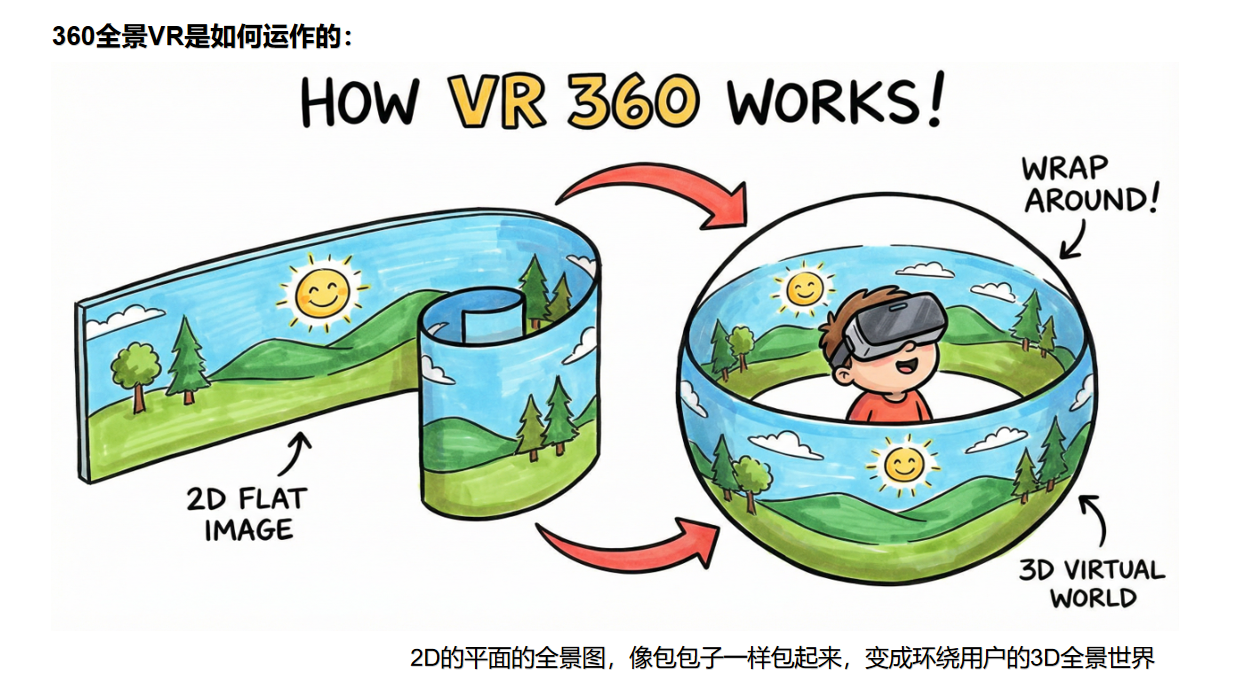
• Selection criteria: Groups were asked to consider narrative interest, visual diversity, and team member preferences when making their choice.
• Voting procedure: If group members could not reach consensus, a structured vote with written justification was required.
E.2.2 AIGC Asset Package
Purpose. To provide students with pre-generated, thematically consistent media assets for VR story construction. The asset package was distributed at the beginning of each session. Students curated, adapted, and assembled these assets rather than creating raw materials from scratch.
Asset Type | Tool / Method | Source | Pedagogical Purpose |
|---|---|---|---|
Story poster and narrative map | Nano-Banana 2 | teacher-mediated | Visual world-building reference |
Illustrated picture books (6 scenes) | Nano-Banana 2 | teacher-mediated | Narrative scaffolding for storytelling |
360° spherical panoramas | Skybox AI | teacher-mediated | VR scene backgrounds |
Voiceover narrations | Jimeng TTS | teacher-mediated | Audio storytelling support |
Sound effect packages | Jimeng / Internet | teacher-mediated / pre-licensed | Immersive atmosphere building |
Background music | CLEVR library (20,000+ CC tracks) | Pre-licensed | Emotional tone without copyright issues |
Note. Students received these packages at the beginning of each session. They curated, adapted, and assembled these assets rather than creating raw materials from scratch. | |||
Figure E-4
Gear City: Story poster and narrative map

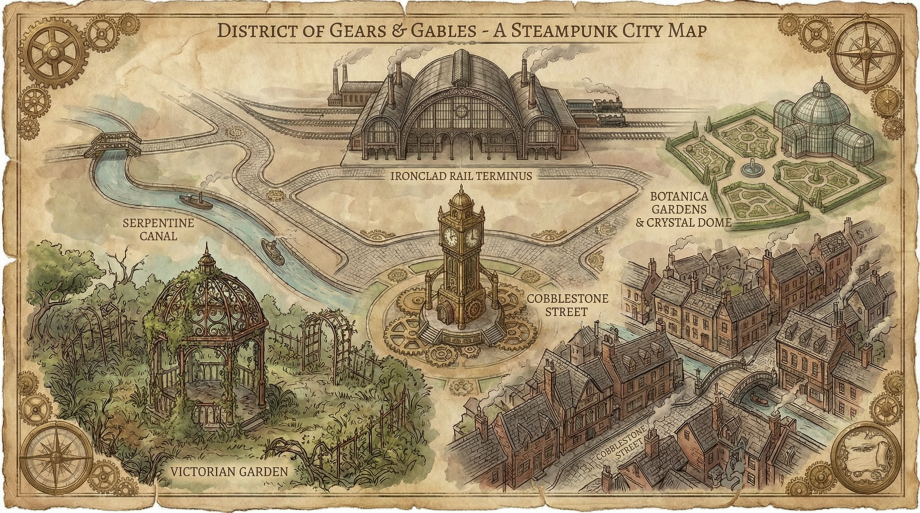
Figure E-5
Illustrated Story Scenes-Gear City
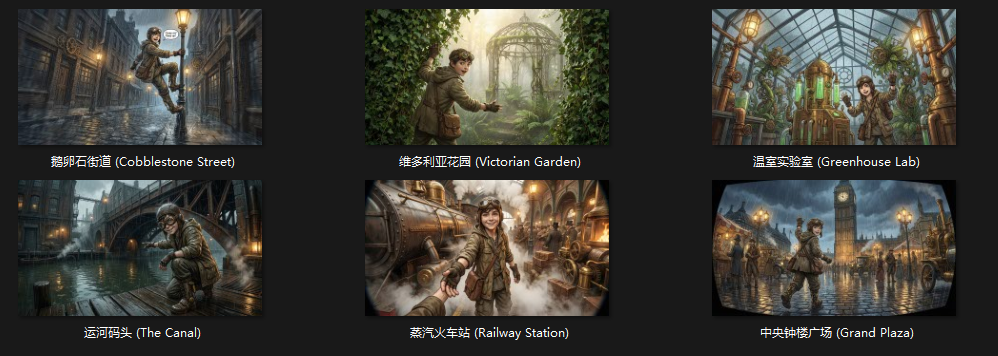
Figure E-6
360°Spherical Panoramas-Gear City
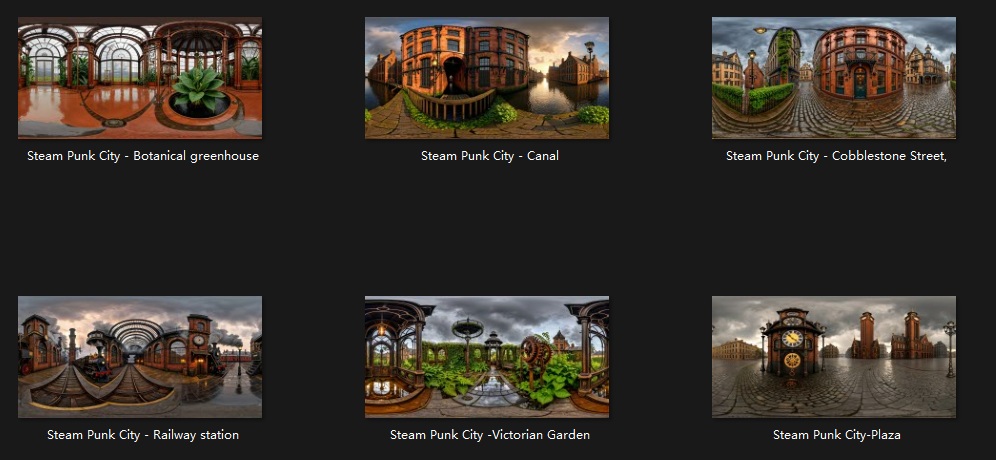
Figure E-7
Voiceover Narrations-Gear City
E.2.3 Storyboard Template
To scaffold narrative planning before VR construction. Groups completed the storyboard during Session 1-2 before accessing the CLEVR platform.
• Scene sequence: Six cells, one per scene, with space for scene title, panoramic image selection, and narrative description.
• Navigation plan: A flow diagram showing the intended visitor path through the six scenes, including entry point, main route, and exit.
• Asset allocation: A table mapping each scene to its required assets (panorama, voiceover, background music, supplementary images).
E.2.4 VR Storybook Checklist and Progress Dashboard
Purpose. To support structured self-assessment and teacher monitoring during Sessions 2-4. Adapted from the Cycle 1 checklist with expanded items reflecting the teacher-mediated AIGC task complexity.
• Scene construction: All 6 panoramas uploaded and positioned correctly.
• Navigation: Bidirectional hotspots between all connected scenes.
• Audio: Background music and voiceover narration placed in at least 4 scenes.
• Text: Scene titles and descriptive annotations complete.
• Aesthetic: Visual consistency maintained across all scenes (no clashing colour schemes or resolution mismatches).
• Presentation: Group can deliver a 3-minute guided tour of their VR story.
Figure E-8
Checklist for the Teacher-Mediated AIGC Task Complexity
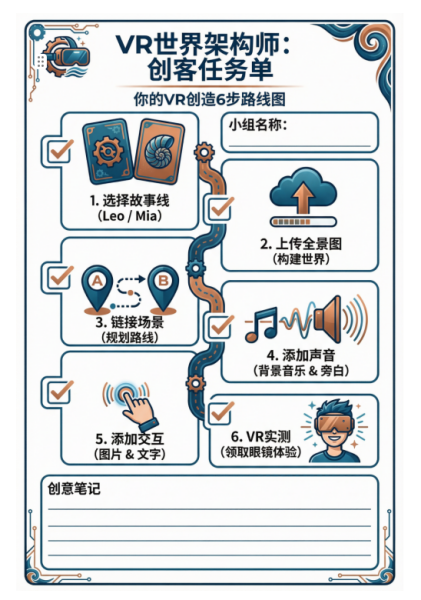
The checklist was integrated into the CLEVR platform dashboard, allowing students to track completion visually. Teachers used the dashboard to identify groups needing support.
E.3 Cycle 3: Multimodal Intervention Materials
E.3.1 Digital Dunhuang Analysis Activity Guide
Purpose. To guide students through a structured analysis of the Digital Dunhuang reference exemplar, extracting design principles for application to their own VR projects. Distributed at the beginning of Session 1.
• Analysis task (pair work, 20 minutes): Students explored the Digital Dunhuang interface, identifying the types of media elements present (panoramas, text, audio, images, navigation) and their arrangement within the spatial layout.
• Extraction worksheet: A structured form asking students to record: (a) the name and function of each media element they identified; (b) how the navigation system connects different locations; (c) what makes the experience feel cohesive rather than fragmented.
• Transfer task (group discussion, 15 minutes): Groups shared their observations and identified three design principles from Digital Dunhuang that they wanted to apply to their own VR world. Each principle was recorded on a transfer card and posted on the classroom wall.
• Design principle examples (provided by instructor after group discussion): (1) Every scene needs a clear purpose that advances the narrative; (2) Navigation should always tell the visitor where they are and where they can go; (3) Audio and text should reinforce each other, not repeat the same information.
E.3.2 World Setting Excerpts
The following excerpts represent the world-setting documents generated in Step 2 of the teacher-mediated asset production protocol (see Section 6.3.2.1). Students received these documents at the beginning of Session 2 as narrative scaffolding for their VR construction. The full documents (approximately 800 words per world) areavailable from the researcher upon request.
Gear City (excerpt). "Gear City rises from the mist of an eternal dawn, a Victorian metropolis where steam power and clockwork ingenuity have shaped every street and tower. The city is organised around six distinct districts, each with its own character and function. The Grand Plaza stands at the centre, dominated by the Great Clock Tower whose chimes regulate the city's daily rhythm. From this hub, five arterial pathways radiate outward: Cobblestone Street, where merchants hawk mechanical curiosities; the Victorian Garden, a refuge of bio-mechanical flora; the Greenhouse Lab, where alchemists cultivate luminous plants; the Canal Docks, where steam-powered barges deliver coal and copper; and the Railway Station, where airship passengers arrive from distant cities..."
Pearl Kingdom (excerpt). "Beneath the surface of the Sapphire Sea lies the Pearl Kingdom, an underwater realm where bioluminescent coral forms the architecture and ancient magic flows through ocean currents. The kingdom centres on the Pearl Palace, seat of the royal family and repository of the Great Pearl that sustains the realm's magic. Five guardian locations surround the palace: the Coral Gate, entrance to the kingdom and first sight for all visitors; the Jellyfish Garden, where gentle creatures perform nightly light displays; the Sunken Library, containing scrolls that record ten thousand years of ocean history; the Turtle Observatory, where scholars chart the movements of celestial bodies through the water's surface; and the Crystal Cave, where the kingdom's youngest citizens learn to channel sea magic..."
E.3.3 Hub-and-Spoke Story Map Template
Purpose. To require students to plan their spatial navigation before building in CLEVR. The story map template was introduced in Session 2 and had to be approved by the instructor before groups could begin platform construction.
• Central hub: Space for the scene title, panoramic image selection, and a description of what visitors see when they first arrive.
• Radiating spokes: Five sections, one per sub-scene, each requiring: scene title, narrative purpose (why this scene exists in the story), connection to the hub (what the visitor learns or experiences), and planned audio/visual elements.
Note: The template shows five spokes; in implementation, groups used three to four spokes (Appendix A).
• Navigation design: Students drew bidirectional arrows between the hub and each spoke, annotating each arrow with the hotspot label visitors would see (e.g., "Enter the Garden", "Return to Plaza").
• Instructor approval: A signature line at the bottom required the instructor to confirm that the spatial logic was coherent before construction began.
[Image description: An A3 worksheet with a large central hexagon (Hub) and five smaller hexagons (Spokes) arranged in a circle around it. Bidirectional arrows connect the hub to each spoke. Each hexagon contains fillable fields: Scene Title, Narrative Purpose, Audio Plan, Visual Plan. The five spokes are colour-coded to match the scene picture books. A signature line appears at the bottom with the label "Instructor Approval."]
E.3.4 Multimodal Asset Integration Guide
Purpose. To guide students through the process of combining multiple media types into a single coherent CLEVR scene. Distributed at the beginning of Session 4.
• An informal question-driven discussion on AI-related risks was held with students during the later sessions (copyright in AI-generated images; voice-mimicking fraud after face-swapping). It is documented here as a session element, not as a formal safety scaffold.
• Layer sequence: The guide specified the recommended order for adding elements to a scene: panoramic background first, then navigation hotspots, then audio layers (background music followed by voiceover), then supplementary images, and finally text annotations.
• Audio mixing: Instructions for balancing background music and voiceover volumes so that narration remained intelligible. Students were advised to set BGM at 30-40% volume relative to voiceover.
• Visual alignment: Guidance for positioning supplementary images within the 360-degree view so they did not obstruct navigation hotspots or distract from the panoramic background.
• Quality checklist: A final review sequence requiring students to test each scene in VR headset mode before proceeding to the next scene.
E.3.5 File Naming Convention and Collaboration Rules
Purpose. To address the asset management chaos documented in Section 6.5.1. The file naming convention was introduced reactively in Session 3 after groups experienced coordination breakdowns. By Session 5, all groups had adopted the convention voluntarily.
• Naming format: WorldName_AssetType_LocationNumber_Version (e.g., GearCity_Panorama_02_v3.jpg).
• Asset type codes: PAN (panorama), PIC (picture book), AUD (audio), TXT (text), NAV (navigation map).
• Folder structure: A shared drive folder for each world, with subfolders for Raw Assets, In Progress, and Final.
• Collaboration rules (student-generated, codified by instructor): Rule 1: All files must use the naming convention. Rule 2: Files in the In Progress folder can be edited by any team member; files in Final require group approval to modify. Rule 3: Anyone who misplaces a file buys milk tea for the team. Rule 4: Major creative decisions require a majority vote.
E.3.6 Navigation Design Criteria
Purpose. To prevent the "lost tourist" problem documented in Section 6.5.2. These criteria were introduced reactively in Session 6 after the initial navigation failures. They were formalised as a laminated reference card distributed to all groups.
• Every scene must have at least one exit path. No dead ends allowed.
• Hotspot labels must describe the destination, not the action (e.g., "Pearl Palace" not "Click here").
• Return paths must mirror forward paths. If visitors can go from Scene A to Scene B, they must be able to return from Scene B to Scene A.
• Orientation cues: Each scene should include visual or audio cues that help visitors understand where they are in the overall structure (e.g., "You are in the Crystal Cave, the fifth location in the Pearl Kingdom").
• The grandmother test: Groups were required to imagine their grandmother navigating the VR world. If she would get lost, the navigation design needs revision.
E.3.7 Peer Evaluation Form
Purpose. To provide structured feedback during the final showcase (Session 10). Each group presented their VR world to two other groups, who completed the evaluation form.
• Narrative coherence (1-5): Does the VR world tell a clear story? Do the scenes connect logically?
• Visual quality (1-5): Are the panoramic images clear and thematically consistent? Is the overall aesthetic appealing?
• Navigation usability (1-5): Could you navigate without getting lost? Were the hotspot labels clear?
• Audio integration (1-5): Did the voiceover and background music enhance the experience?
• One thing I liked: Open-ended positive feedback.
• One thing to improve: Open-ended constructive feedback.
Completed evaluation forms were collected by the instructor and returned to the presenting groups as written feedback. The peer evaluation scores were not used for formal assessment but served as formative feedback for revision.
E.4 Production Notes for Replicating This Intervention
E.4.1 AIGC Tool Specifications
• Text generation: Kimi (Moonshot AI), accessed through the web interface. Prompt template available from the researcher upon request.
• Image generation:Nano-Banana 2 for story posters, picture books, and scene illustrations.
• Panoramic generation: Skybox AI (Blockade Labs), accessed through the web interface. Prompts required 5-10 iterations per scene to achieve visual consistency.
• Voice synthesis: Jimeng text-to-speech feature, female voice (Pearl Kingdom) and male voice (Gear City). Parameters: speed 1.0x, pitch standard, output format MP3 at 192kbps.
• Background music: Sourced from the CLEVR platform's built-in library (20,000+ CC-licensed tracks). Selection criteria: instrumental only, tempo matched to world atmosphere, loop-friendly.
E.4.2 Time Requirements
• Asset production (teacher): Approximately 6 hours per world (3 hours text and image generation, 2 hours voiceover and audio editing, 1 hours review and quality control).
• Session preparation (teacher): 30 minutes per session (materials distribution, equipment check, brief review of group progress).
• Student time on task: 4 sessions x 45 minutes (Cycle 1), 4 sessions x 45 minutes (Cycle 2), 10 sessions x 45 minutes (Cycle 3).
E.4.3 Technical Requirements
• Hardware: School computer lab with Windows PCs (minimum 8GB RAM, dedicated graphics card recommended for VR preview), one VR headset per 4-5 students (Pico G2 or equivalent), smartphones for Cycle 1 panoramic capture.
• Software: CLEVR platform (web-based, Chrome or Edge browser recommended), Around Capture app (iOS/Android) for Cycle 1 capture.
• Network: Stable internet connection (minimum 10 Mbps) for asset download and CLEVR platform access.
• Storage: Cloud-based shared drive (e.g., Google Drive, OneDrive) for asset distribution and group file management.
All curriculum materials described in this appendix are available from the researcher upon request. Digital versions of templates, worksheets, and asset packages can be shared under a Creative Commons Attribution-NonCommercial 4.0 license for educational use.